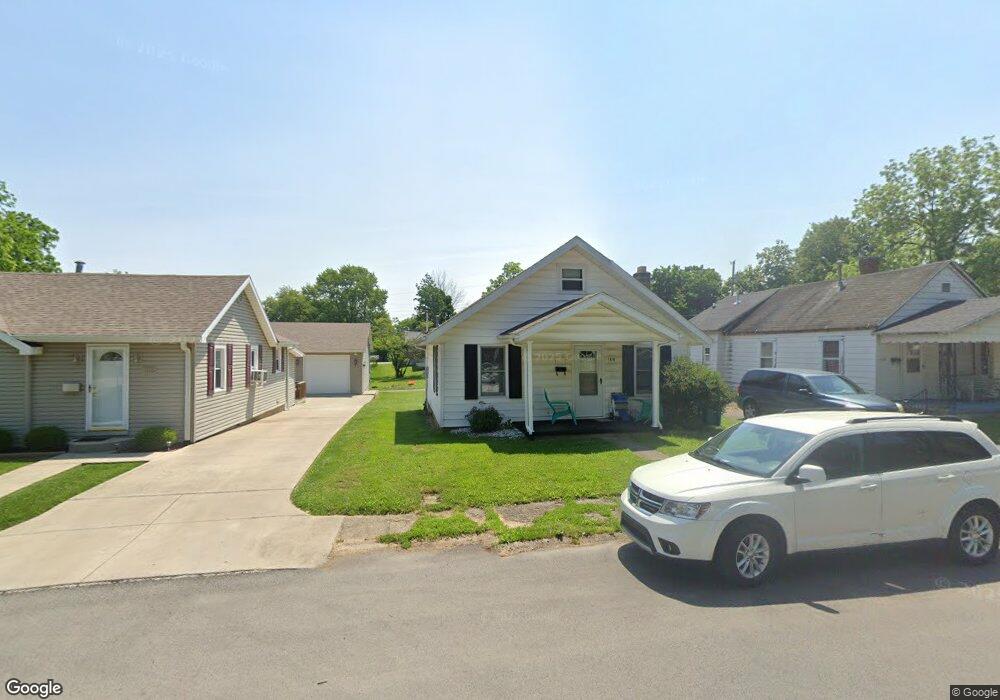
1618 Ross St New Castle, IN 47362
Estimated Value: $81,000 - $108,000
2
Beds
1
Bath
796
Sq Ft
$119/Sq Ft
Est. Value
About This Home
This home is located at 1618 Ross St, New Castle, IN 47362 and is currently estimated at $94,335, approximately $118 per square foot. 1618 Ross St is a home located in Henry County with nearby schools including Agape Learning Center.
Ownership History
Date
Name
Owned For
Owner Type
Purchase Details
Closed on
Jun 23, 2009
Sold by
Fannie Mae
Bought by
Stanley Dori R and Stanley Michael D
Current Estimated Value
Home Financials for this Owner
Home Financials are based on the most recent Mortgage that was taken out on this home.
Original Mortgage
$16,575
Interest Rate
4.94%
Mortgage Type
Purchase Money Mortgage
Purchase Details
Closed on
Apr 15, 2009
Sold by
Countrywide Home Loans Servicing Lp
Bought by
Federal National Mortgage Association
Purchase Details
Closed on
Feb 12, 2009
Sold by
Groce Kelly D and Groce Kelly R
Bought by
Countrywide Home Loans Inc
Create a Home Valuation Report for This Property
The Home Valuation Report is an in-depth analysis detailing your home's value as well as a comparison with similar homes in the area
Home Values in the Area
Average Home Value in this Area
Purchase History
| Date | Buyer | Sale Price | Title Company |
|---|---|---|---|
| Stanley Dori R | -- | Meridian Title Corp | |
| Federal National Mortgage Association | -- | None Available | |
| Countrywide Home Loans Inc | $60,007 | None Available |
Source: Public Records
Mortgage History
| Date | Status | Borrower | Loan Amount |
|---|---|---|---|
| Closed | Stanley Dori R | $16,575 |
Source: Public Records
Tax History Compared to Growth
Tax History
| Year | Tax Paid | Tax Assessment Tax Assessment Total Assessment is a certain percentage of the fair market value that is determined by local assessors to be the total taxable value of land and additions on the property. | Land | Improvement |
|---|---|---|---|---|
| 2024 | $369 | $40,500 | $8,000 | $32,500 |
| 2023 | $317 | $35,500 | $8,000 | $27,500 |
| 2022 | $335 | $33,500 | $5,300 | $28,200 |
| 2021 | $305 | $30,500 | $4,600 | $25,900 |
| 2020 | $336 | $30,700 | $4,600 | $26,100 |
| 2019 | $343 | $31,300 | $4,600 | $26,700 |
| 2018 | $334 | $31,000 | $4,600 | $26,400 |
| 2017 | $205 | $30,700 | $4,600 | $26,100 |
| 2016 | $162 | $26,800 | $4,600 | $22,200 |
| 2014 | $114 | $25,700 | $4,600 | $21,100 |
| 2013 | $114 | $26,000 | $4,600 | $21,400 |
Source: Public Records
Map
Nearby Homes