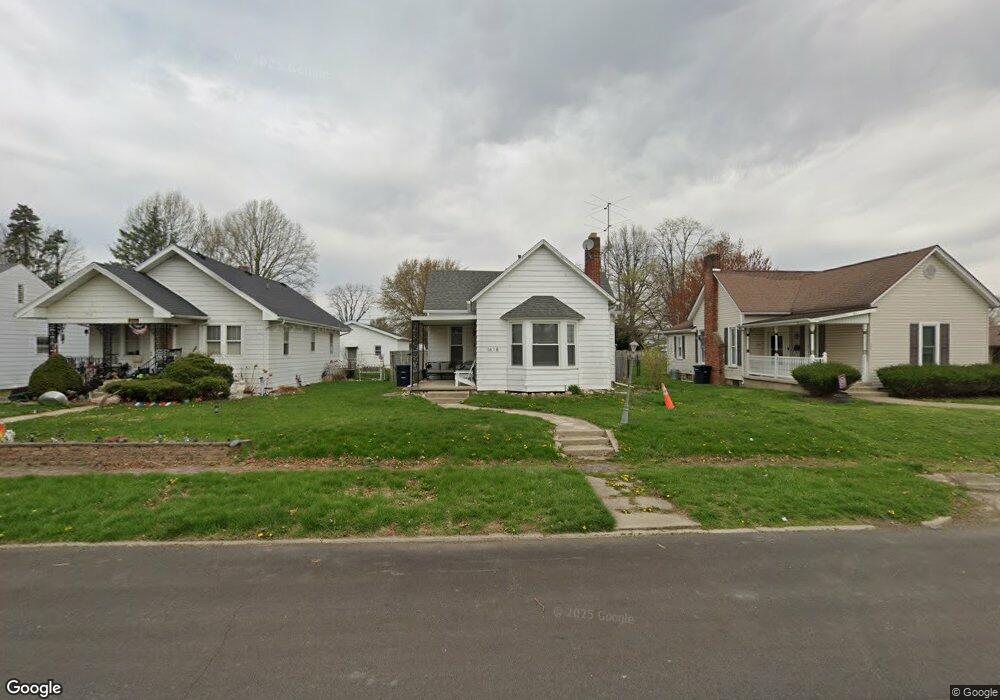
1618 S I St Elwood, IN 46036
Estimated Value: $91,000 - $141,585
2
Beds
1
Bath
2,072
Sq Ft
$58/Sq Ft
Est. Value
About This Home
This home is located at 1618 S I St, Elwood, IN 46036 and is currently estimated at $119,396, approximately $57 per square foot. 1618 S I St is a home located in Madison County with nearby schools including Elwood Elementary School, Elwood Intermediate School, and Elwood Junior-Senior High School.
Ownership History
Date
Name
Owned For
Owner Type
Purchase Details
Closed on
Dec 27, 2023
Sold by
Updegraff Daniel J
Bought by
Wilson Jakob D
Current Estimated Value
Purchase Details
Closed on
Jan 12, 2007
Sold by
Wm Speciality Mortgage Llc
Bought by
Updegraff Daniel Joe
Purchase Details
Closed on
Jun 9, 2006
Sold by
Enstrom Mark E and Enstrom Carrie L
Bought by
Wm Specialty Mortgage Llc
Create a Home Valuation Report for This Property
The Home Valuation Report is an in-depth analysis detailing your home's value as well as a comparison with similar homes in the area
Home Values in the Area
Average Home Value in this Area
Purchase History
| Date | Buyer | Sale Price | Title Company |
|---|---|---|---|
| Wilson Jakob D | $77,000 | None Listed On Document | |
| Updegraff Daniel Joe | -- | -- | |
| Wm Specialty Mortgage Llc | $40,500 | -- |
Source: Public Records
Tax History Compared to Growth
Tax History
| Year | Tax Paid | Tax Assessment Tax Assessment Total Assessment is a certain percentage of the fair market value that is determined by local assessors to be the total taxable value of land and additions on the property. | Land | Improvement |
|---|---|---|---|---|
| 2024 | $553 | $55,300 | $9,300 | $46,000 |
| 2023 | $505 | $50,500 | $8,800 | $41,700 |
| 2022 | $1,010 | $50,000 | $8,300 | $41,700 |
| 2021 | $928 | $46,400 | $8,300 | $38,100 |
| 2020 | $896 | $44,300 | $7,900 | $36,400 |
| 2019 | $874 | $43,200 | $7,900 | $35,300 |
| 2018 | $828 | $40,900 | $7,900 | $33,000 |
| 2017 | $810 | $40,500 | $7,900 | $32,600 |
| 2016 | $608 | $29,900 | $7,900 | $22,000 |
| 2014 | $588 | $29,400 | $7,900 | $21,500 |
| 2013 | $588 | $29,400 | $7,900 | $21,500 |
Source: Public Records
Map
Nearby Homes