Estimated Value: $281,000 - $320,000
3
Beds
2
Baths
1,718
Sq Ft
$170/Sq Ft
Est. Value
About This Home
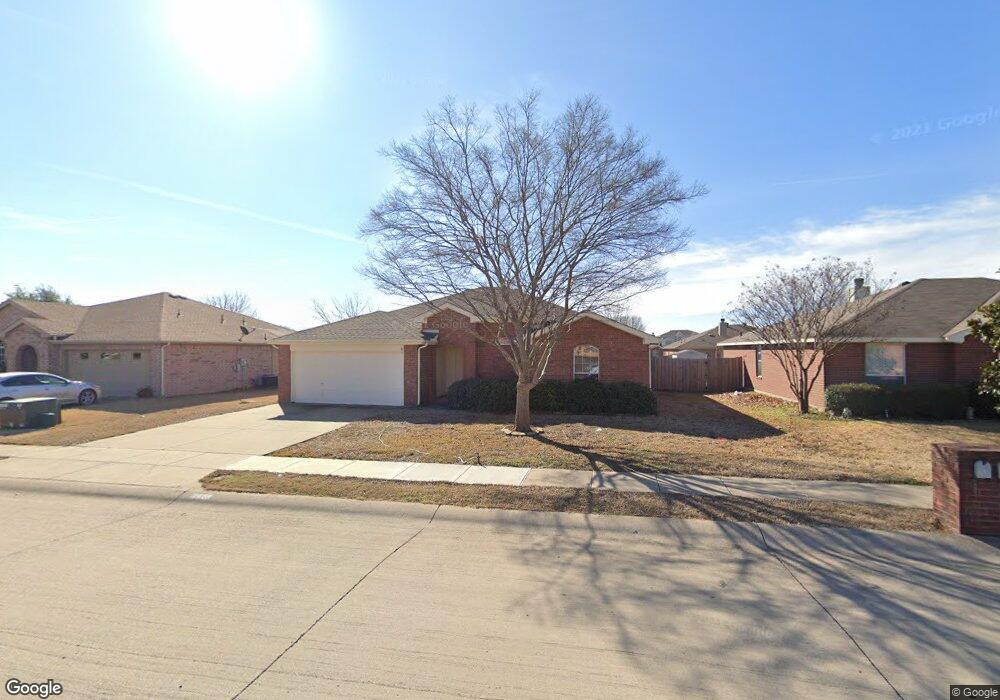
This home is located at 1618 Sequoia Dr, Krum, TX 76249 and is currently estimated at $291,910, approximately $169 per square foot. 1618 Sequoia Dr is a home located in Denton County with nearby schools including Krum Early Education Center, Blanche Dodd Intermediate School, and Krum Middle School.
Ownership History
Date
Name
Owned For
Owner Type
Purchase Details
Closed on
Oct 8, 2018
Sold by
Farmer Chris A and Farmer Angie D
Bought by
Yun Xiao
Current Estimated Value
Purchase Details
Closed on
Apr 11, 2017
Sold by
Warmoth Mike
Bought by
Farmer Chris A and Farmer Angie D
Home Financials for this Owner
Home Financials are based on the most recent Mortgage that was taken out on this home.
Original Mortgage
$104,000
Interest Rate
4.1%
Mortgage Type
New Conventional
Purchase Details
Closed on
Jun 6, 2008
Sold by
Warmoth Mike and Warmoth Joy
Bought by
Warmoth Mike
Purchase Details
Closed on
Jan 22, 2004
Sold by
History Maker Inc
Bought by
Warmoth Mike and Warmoth Joy
Home Financials for this Owner
Home Financials are based on the most recent Mortgage that was taken out on this home.
Original Mortgage
$116,964
Interest Rate
5.78%
Mortgage Type
FHA
Create a Home Valuation Report for This Property
The Home Valuation Report is an in-depth analysis detailing your home's value as well as a comparison with similar homes in the area
Home Values in the Area
Average Home Value in this Area
Purchase History
| Date | Buyer | Sale Price | Title Company |
|---|---|---|---|
| Yun Xiao | -- | Republic Title Of Texas Inc | |
| Farmer Chris A | -- | Title Resources | |
| Warmoth Mike | -- | Freedom Title | |
| Warmoth Mike | -- | -- |
Source: Public Records
Mortgage History
| Date | Status | Borrower | Loan Amount |
|---|---|---|---|
| Previous Owner | Farmer Chris A | $104,000 | |
| Previous Owner | Warmoth Mike | $116,964 |
Source: Public Records
Tax History
| Year | Tax Paid | Tax Assessment Tax Assessment Total Assessment is a certain percentage of the fair market value that is determined by local assessors to be the total taxable value of land and additions on the property. | Land | Improvement |
|---|---|---|---|---|
| 2025 | $4,422 | $293,471 | $67,536 | $225,935 |
| 2024 | $5,661 | $280,913 | $0 | $0 |
| 2023 | $3,915 | $255,375 | $67,536 | $250,478 |
| 2022 | $5,325 | $232,159 | $67,536 | $195,018 |
| 2021 | $4,680 | $211,054 | $42,398 | $168,656 |
| 2020 | $4,440 | $196,079 | $42,398 | $153,681 |
| 2019 | $4,770 | $197,673 | $42,398 | $155,275 |
| 2018 | $4,388 | $180,930 | $42,398 | $138,532 |
| 2017 | $3,978 | $163,314 | $42,398 | $122,189 |
| 2016 | $3,617 | $148,467 | $28,140 | $121,556 |
| 2015 | $2,893 | $134,970 | $28,140 | $106,830 |
| 2013 | -- | $124,338 | $28,140 | $96,198 |
Source: Public Records
Map
Nearby Homes
- 1606 Withers Way
- 105 Thoroughbred Dr
- 101 Thoroughbred Dr
- 3207 Camden Creek Rd
- TBD Masch Branch Rd
- 205 Comanche Trail
- 334 Saddlebrook Dr
- 0 Farm To Market Road 1173
- 3425 Eloise Ln
- 3724 Ranchers Ridge
- TBD Hopkins Rd
- 3725 Ranchers Ridge
- 905 Clearview St
- 5276 Albert Ct
- 5258 Albert Ct
- 107 N 7th St
- 4124 Herdsman Dr
- 4125 Shady Ln
- 101 N 7th St
- 7272 Christina Ct
- 1620 Sequoia Dr
- 1616 Sequoia Dr
- 1619 Appaloosa Dr
- 1621 Appaloosa Dr
- 1617 Appaloosa Dr
- 1622 Sequoia Dr
- 1614 Sequoia Dr
- 123 Palomino Ln
- 1615 Appaloosa Dr
- 1623 Appaloosa Dr
- 124 Thoroughbred Dr
- 1612 Sequoia Dr
- 121 Palomino Ln
- 1613 Appaloosa Dr
- 1623 Sequoia Dr
- 1625 Appaloosa Dr
- 122 Thoroughbred Dr
- 1610 Sequoia Dr
- 1618 Appaloosa Dr
- 119 Palomino Ln
Your Personal Tour Guide
Ask me questions while you tour the home.