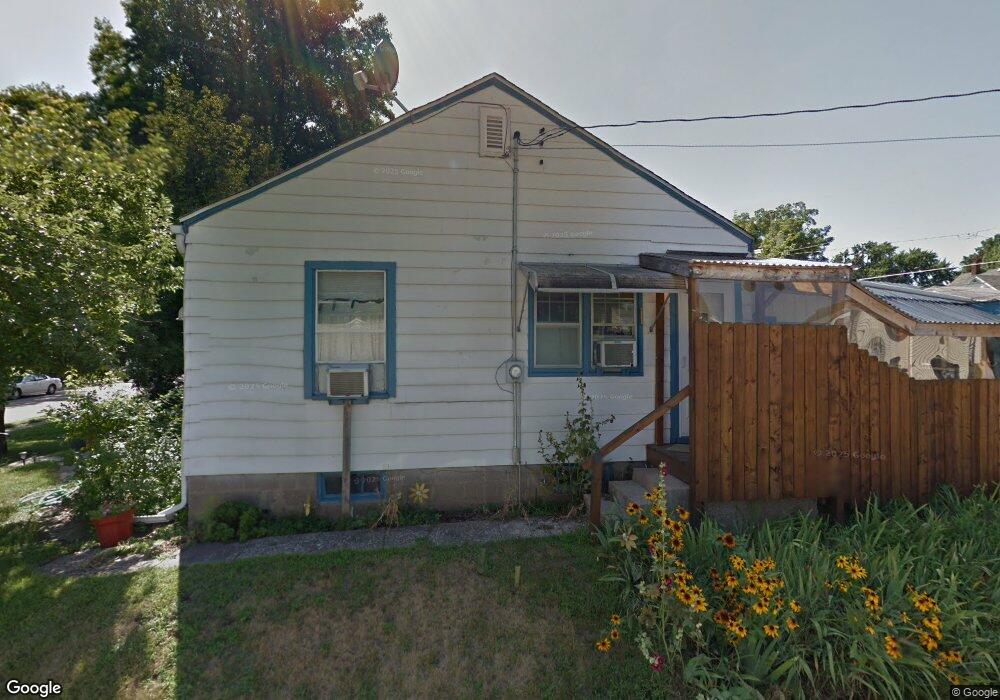
1618 W 36th St Davenport, IL 52806
Northwest Davenport NeighborhoodEstimated Value: $114,000 - $135,000
2
Beds
2
Baths
720
Sq Ft
$174/Sq Ft
Est. Value
About This Home
This home is located at 1618 W 36th St, Davenport, IL 52806 and is currently estimated at $125,220, approximately $173 per square foot. 1618 W 36th St is a home located in Scott County with nearby schools including Tygart Creek Elementary School, Adams Elementary School, and Christian County Day Treatment Center Alt.
Ownership History
Date
Name
Owned For
Owner Type
Purchase Details
Closed on
Sep 27, 2022
Sold by
Roi Capital Llc
Bought by
Vanhorn Nicolaas and Vanhorn Van Horn
Current Estimated Value
Home Financials for this Owner
Home Financials are based on the most recent Mortgage that was taken out on this home.
Original Mortgage
$98,325
Outstanding Balance
$93,847
Interest Rate
5.13%
Mortgage Type
New Conventional
Estimated Equity
$31,373
Purchase Details
Closed on
Oct 30, 2014
Sold by
Burton Myrene L
Bought by
Koeppel Jonathon J and Koeppel Amanda M
Home Financials for this Owner
Home Financials are based on the most recent Mortgage that was taken out on this home.
Original Mortgage
$44,840
Interest Rate
4.19%
Mortgage Type
New Conventional
Purchase Details
Closed on
Oct 28, 2014
Sold by
Martin Linda Jean and Martin Michael
Bought by
Koeppel Jonathan J and Koeppel Amanda M
Home Financials for this Owner
Home Financials are based on the most recent Mortgage that was taken out on this home.
Original Mortgage
$44,840
Interest Rate
4.19%
Mortgage Type
New Conventional
Create a Home Valuation Report for This Property
The Home Valuation Report is an in-depth analysis detailing your home's value as well as a comparison with similar homes in the area
Home Values in the Area
Average Home Value in this Area
Purchase History
| Date | Buyer | Sale Price | Title Company |
|---|---|---|---|
| Vanhorn Nicolaas | $103,500 | None Listed On Document | |
| Koeppel Jonathon J | -- | None Available | |
| Koeppel Jonathon J | -- | None Available | |
| Koeppel Jonathan J | -- | None Available | |
| Koeppel Jonathon J | $60,000 | None Available |
Source: Public Records
Mortgage History
| Date | Status | Borrower | Loan Amount |
|---|---|---|---|
| Open | Vanhorn Nicolaas | $98,325 | |
| Previous Owner | Koeppel Jonathon J | $44,840 |
Source: Public Records
Tax History Compared to Growth
Tax History
| Year | Tax Paid | Tax Assessment Tax Assessment Total Assessment is a certain percentage of the fair market value that is determined by local assessors to be the total taxable value of land and additions on the property. | Land | Improvement |
|---|---|---|---|---|
| 2025 | $2,146 | $140,500 | $18,050 | $122,450 |
| 2024 | $1,836 | $120,090 | $18,050 | $102,040 |
| 2023 | $1,796 | $105,260 | $18,050 | $87,210 |
| 2022 | $1,979 | $84,080 | $15,790 | $68,290 |
| 2021 | $1,730 | $80,600 | $15,790 | $64,810 |
| 2020 | $2,089 | $79,440 | $15,790 | $63,650 |
| 2019 | $2,249 | $76,550 | $15,790 | $60,760 |
| 2018 | $2,122 | $76,550 | $15,790 | $60,760 |
| 2017 | $1,674 | $73,660 | $15,790 | $57,870 |
| 2016 | $1,886 | $73,660 | $0 | $0 |
| 2015 | $1,614 | $75,260 | $0 | $0 |
| 2014 | $1,404 | $75,260 | $0 | $0 |
| 2013 | $1,374 | $0 | $0 | $0 |
| 2012 | -- | $73,260 | $17,180 | $56,080 |
Source: Public Records
Map
Nearby Homes
- 1617 W 38th St
- 3831 N Sturdevant St
- 1517 W Kimberly Rd
- 3433 Washington St
- 3612 Wilkes Ave
- 1344 W 37th St
- 1336 W 38th Place
- 1453 W 41st St
- 4132 Rodeo Rd
- Lot 29 W 34th St
- 2159 W 35th St
- 1514 W Garfield St
- 1358 W Garfield St
- 2223 W 34th St
- 2149 W 30th St
- 2222 W 30th St
- 1636 W Columbia Ave
- 3205 N Pine St
- 4618 Fillmore Ln
- 2738 Kelling St
- 1618 W 36th St
- 1624 W 36th St
- 1628 W 36th St
- 1606 W 36th St
- 3612 N Sturdevant St
- 3616 N Sturdevant St
- 1632 W 36th St
- 1615 W 37th St
- 1621 W 37th St
- 5090 N Sturdevant St
- 1615 W 36th St
- 1619 W 36th St
- 1627 W 37th St
- 1609 W 36th St
- 1625 W 36th St
- 1638 W 36th St
- 3624 N Sturdevant St
- 1631 W 37th St
- 1603 W 36th St
- 1631 W 36th St