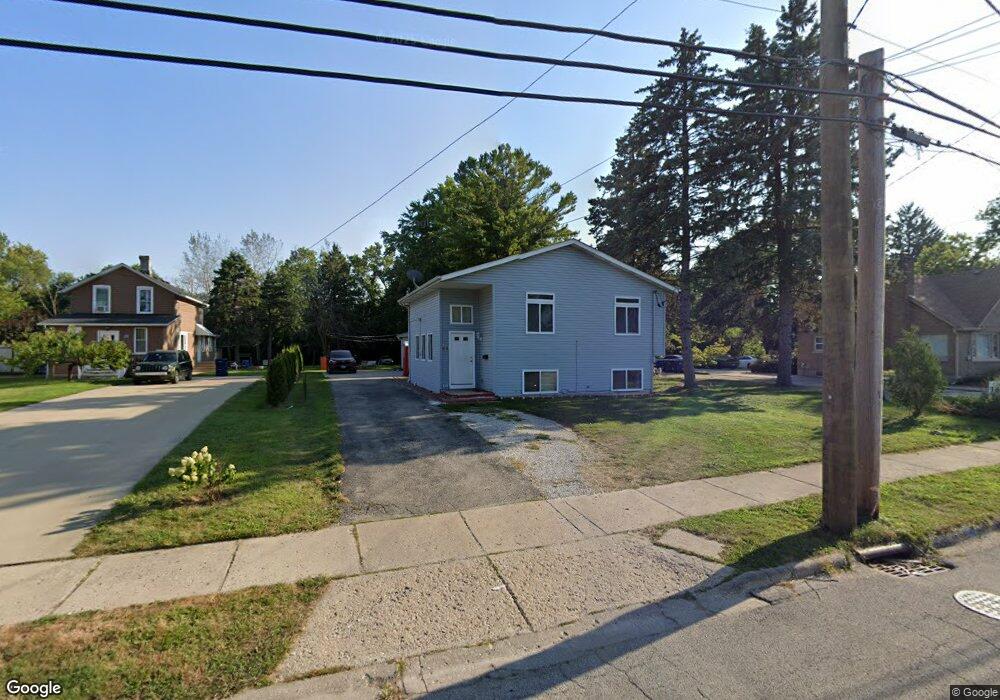
1619 10th St Waukegan, IL 60085
Lyon Acres NeighborhoodEstimated Value: $255,000 - $386,000
5
Beds
4
Baths
1,289
Sq Ft
$248/Sq Ft
Est. Value
About This Home
This home is located at 1619 10th St, Waukegan, IL 60085 and is currently estimated at $320,087, approximately $248 per square foot. 1619 10th St is a home located in Lake County with nearby schools including Clearview Elementary School, John R Lewis Middle School, and Waukegan High School.
Ownership History
Date
Name
Owned For
Owner Type
Purchase Details
Closed on
Sep 14, 2017
Sold by
Beor Fund 1 Llc
Bought by
Pizano Luz Maria
Current Estimated Value
Purchase Details
Closed on
Feb 16, 2017
Sold by
County Of Lake
Bought by
Beor Fund I Llc
Purchase Details
Closed on
Feb 2, 2010
Sold by
Gmac Mortgage Llc
Bought by
Adilios Professional Carpets Inc
Purchase Details
Closed on
Jul 15, 2009
Sold by
Mazon Estela and Case #08 Ch 1584
Bought by
Gmac Mortgage Llc
Purchase Details
Closed on
Aug 24, 2006
Sold by
Forever Construction Inc
Bought by
Mazon Estela
Home Financials for this Owner
Home Financials are based on the most recent Mortgage that was taken out on this home.
Original Mortgage
$148,000
Interest Rate
8.39%
Mortgage Type
Purchase Money Mortgage
Purchase Details
Closed on
Dec 1, 2005
Sold by
Binning Construction Inc
Bought by
Forever Construction Inc
Purchase Details
Closed on
Jul 20, 2005
Sold by
Fainelli Margaret
Bought by
Binning Construction Inc
Create a Home Valuation Report for This Property
The Home Valuation Report is an in-depth analysis detailing your home's value as well as a comparison with similar homes in the area
Home Values in the Area
Average Home Value in this Area
Purchase History
| Date | Buyer | Sale Price | Title Company |
|---|---|---|---|
| Pizano Luz Maria | $50,000 | Fidelity National Title | |
| Beor Fund I Llc | -- | Attorney | |
| Adilios Professional Carpets Inc | $75,000 | First American Title | |
| Gmac Mortgage Llc | -- | None Available | |
| Mazon Estela | $185,000 | None Available | |
| Forever Construction Inc | $67,500 | First American Title Ins | |
| Binning Construction Inc | $85,000 | Multiple |
Source: Public Records
Mortgage History
| Date | Status | Borrower | Loan Amount |
|---|---|---|---|
| Previous Owner | Mazon Estela | $148,000 |
Source: Public Records
Tax History Compared to Growth
Tax History
| Year | Tax Paid | Tax Assessment Tax Assessment Total Assessment is a certain percentage of the fair market value that is determined by local assessors to be the total taxable value of land and additions on the property. | Land | Improvement |
|---|---|---|---|---|
| 2024 | $8,484 | $104,212 | $19,284 | $84,928 |
| 2023 | $8,531 | $91,691 | $15,827 | $75,864 |
| 2022 | $8,531 | $88,452 | $13,129 | $75,323 |
| 2021 | $8,283 | $80,791 | $11,711 | $69,080 |
| 2020 | $1,858 | $16,665 | $10,910 | $5,755 |
| 2019 | $7,782 | $63,534 | $9,997 | $53,537 |
| 2018 | $2,187 | $63,480 | $7,075 | $56,405 |
| 2017 | $7,882 | $56,162 | $6,259 | $49,903 |
| 2016 | $7,449 | $48,803 | $5,439 | $43,364 |
| 2015 | $7,200 | $43,679 | $4,868 | $38,811 |
| 2014 | $5,418 | $32,513 | $2,509 | $30,004 |
| 2012 | $6,686 | $35,226 | $2,719 | $32,507 |
Source: Public Records
Map
Nearby Homes
- 1712 11th St
- 819 S Fulton Ave
- 1511 14th St
- 1244 Victoria Ave
- 724 10th St
- 1210 Park Ave
- 815 Prescott St
- 910 Cummings Ave
- 1521 Seymour Ave
- 1101 Adams St
- 720 13th St
- 1301 Park Ave
- 1423 Victoria Ave
- 1102 Wadsworth Ave
- 631 8th St
- 842 Wadsworth Ave
- 1535 Glenn Dr
- 1617 Grove Ave
- 1542 Victoria Ave
- 446 S Jackson St