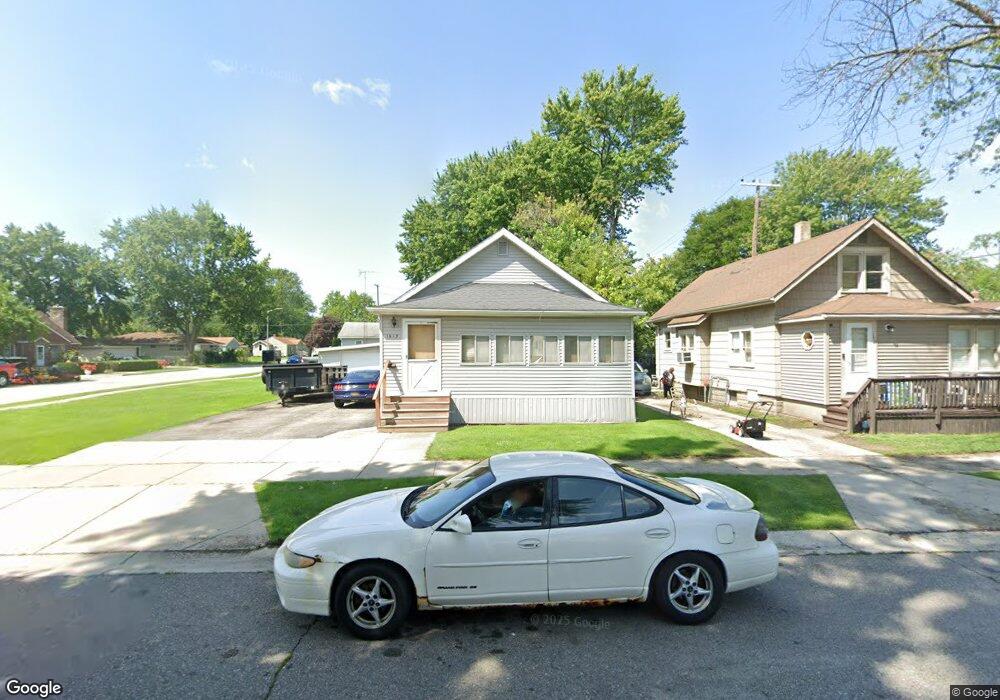
1619 21st St Port Huron, MI 48060
Estimated Value: $97,000 - $116,530
2
Beds
1
Bath
768
Sq Ft
$139/Sq Ft
Est. Value
About This Home
This home is located at 1619 21st St, Port Huron, MI 48060 and is currently estimated at $107,133, approximately $139 per square foot. 1619 21st St is a home located in St. Clair County with nearby schools including Michigamme Elementary School, Central Middle School, and Port Huron High School.
Ownership History
Date
Name
Owned For
Owner Type
Purchase Details
Closed on
May 14, 2010
Sold by
Bland Christopher S and Bland Nicodemus E
Bought by
Bland Jamien M
Current Estimated Value
Purchase Details
Closed on
Oct 30, 2009
Sold by
Bland Jeanne
Bought by
Bland Christopher S and Bland Jamien M
Purchase Details
Closed on
May 23, 2007
Sold by
Andrews Virginia J
Bought by
Andrews Virginia J and Virginia J Andrews Revocable Living Trus
Create a Home Valuation Report for This Property
The Home Valuation Report is an in-depth analysis detailing your home's value as well as a comparison with similar homes in the area
Home Values in the Area
Average Home Value in this Area
Purchase History
| Date | Buyer | Sale Price | Title Company |
|---|---|---|---|
| Bland Jamien M | -- | None Available | |
| Bland Christopher S | -- | None Available | |
| Bland Jeanne | -- | None Available | |
| Andrews Virginia J | -- | None Available |
Source: Public Records
Tax History Compared to Growth
Tax History
| Year | Tax Paid | Tax Assessment Tax Assessment Total Assessment is a certain percentage of the fair market value that is determined by local assessors to be the total taxable value of land and additions on the property. | Land | Improvement |
|---|---|---|---|---|
| 2025 | $1,156 | $46,500 | $0 | $0 |
| 2024 | $924 | $44,100 | $0 | $0 |
| 2023 | $1,224 | $39,200 | $0 | $0 |
| 2022 | $1,181 | $32,400 | $0 | $0 |
| 2021 | $1,128 | $28,200 | $0 | $0 |
| 2020 | $1,133 | $24,700 | $24,700 | $0 |
| 2019 | $1,113 | $17,400 | $0 | $0 |
| 2018 | $1,088 | $17,400 | $0 | $0 |
| 2017 | $999 | $16,400 | $0 | $0 |
| 2016 | $880 | $16,400 | $0 | $0 |
| 2015 | $926 | $16,300 | $16,300 | $0 |
| 2014 | $926 | $17,200 | $17,200 | $0 |
| 2013 | -- | $18,900 | $0 | $0 |
Source: Public Records
Map
Nearby Homes