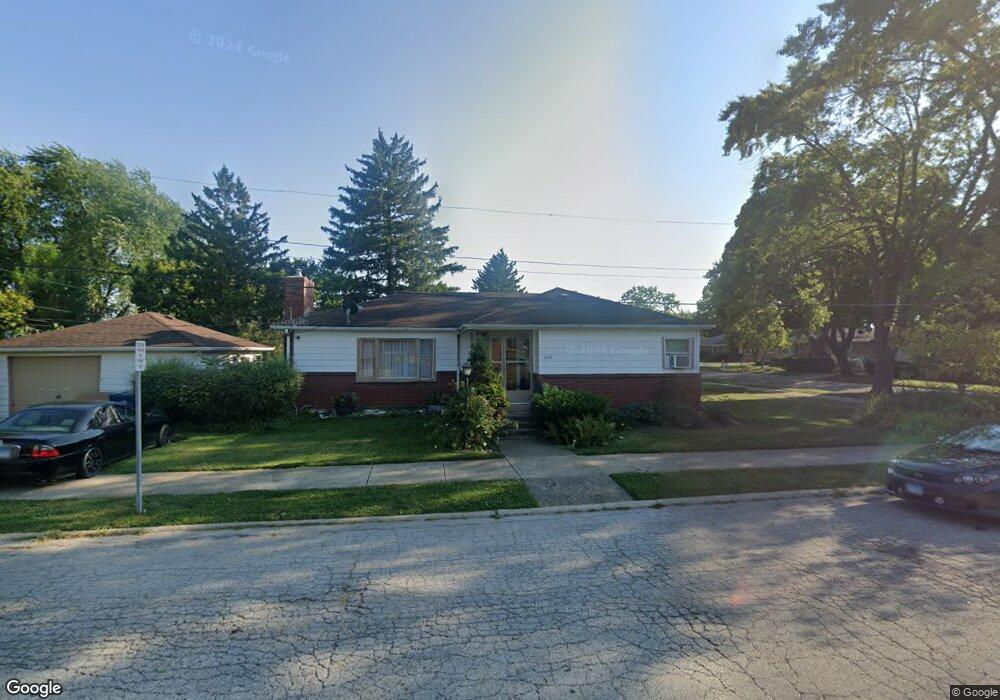
1619 8th St Waukegan, IL 60085
Lyon Acres NeighborhoodEstimated Value: $233,000 - $270,000
2
Beds
2
Baths
1,200
Sq Ft
$205/Sq Ft
Est. Value
About This Home
This home is located at 1619 8th St, Waukegan, IL 60085 and is currently estimated at $246,112, approximately $205 per square foot. 1619 8th St is a home located in Lake County with nearby schools including Lyon Magnet Elementary School, John R Lewis Middle School, and Waukegan High School.
Ownership History
Date
Name
Owned For
Owner Type
Purchase Details
Closed on
Oct 1, 2010
Sold by
Veritas Legacy Alliance Llc
Bought by
Toledo Yolanda
Current Estimated Value
Home Financials for this Owner
Home Financials are based on the most recent Mortgage that was taken out on this home.
Original Mortgage
$101,134
Interest Rate
4.75%
Mortgage Type
FHA
Purchase Details
Closed on
Apr 13, 2010
Sold by
Federal Home Loan Mortgage Corporation
Bought by
Veritas Legacy Alliance Llc
Purchase Details
Closed on
Apr 9, 2009
Sold by
Chavez Alejandro
Bought by
Federal Home Loan Mortgage Corp
Purchase Details
Closed on
Nov 30, 2001
Sold by
Nerit Estela V and Nerit Nestor V
Bought by
Chavez Alejandro and Arceo Maria Del Socorro
Home Financials for this Owner
Home Financials are based on the most recent Mortgage that was taken out on this home.
Original Mortgage
$120,582
Interest Rate
6.52%
Mortgage Type
FHA
Create a Home Valuation Report for This Property
The Home Valuation Report is an in-depth analysis detailing your home's value as well as a comparison with similar homes in the area
Home Values in the Area
Average Home Value in this Area
Purchase History
| Date | Buyer | Sale Price | Title Company |
|---|---|---|---|
| Toledo Yolanda | $103,000 | St | |
| Veritas Legacy Alliance Llc | $45,000 | Attorneys Title Guaranty Fun | |
| Federal Home Loan Mortgage Corp | -- | None Available | |
| Chavez Alejandro | $122,500 | -- |
Source: Public Records
Mortgage History
| Date | Status | Borrower | Loan Amount |
|---|---|---|---|
| Previous Owner | Toledo Yolanda | $101,134 | |
| Previous Owner | Chavez Alejandro | $120,582 |
Source: Public Records
Tax History Compared to Growth
Tax History
| Year | Tax Paid | Tax Assessment Tax Assessment Total Assessment is a certain percentage of the fair market value that is determined by local assessors to be the total taxable value of land and additions on the property. | Land | Improvement |
|---|---|---|---|---|
| 2024 | $4,607 | $63,562 | $8,722 | $54,840 |
| 2023 | $4,712 | $56,858 | $7,803 | $49,055 |
| 2022 | $4,712 | $54,199 | $6,927 | $47,272 |
| 2021 | $4,164 | $45,938 | $5,957 | $39,981 |
| 2020 | $4,171 | $42,797 | $5,550 | $37,247 |
| 2019 | $4,145 | $39,217 | $5,086 | $34,131 |
| 2018 | $3,722 | $35,171 | $6,399 | $28,772 |
| 2017 | $3,573 | $31,116 | $5,661 | $25,455 |
| 2016 | $3,251 | $27,038 | $4,919 | $22,119 |
| 2015 | $3,074 | $24,200 | $4,403 | $19,797 |
| 2014 | $3,763 | $27,782 | $4,856 | $22,926 |
| 2012 | $3,719 | $30,099 | $5,262 | $24,837 |
Source: Public Records
Map
Nearby Homes
- 819 S Fulton Ave
- 1712 11th St
- 910 Cummings Ave
- 815 Prescott St
- 724 10th St
- 446 S Jackson St
- 631 8th St
- 1244 Victoria Ave
- 842 Wadsworth Ave
- 12601 W Atlantic Ave
- 2116 & 2101 Williamsburg Dr
- 1511 14th St
- 600 Sunderlin St
- 1210 Park Ave
- 1101 Adams St
- 1102 Wadsworth Ave
- 831 S Mcalister Ave
- 720 13th St
- 515 George Ave
- 1301 Park Ave
- 809 S Fulton Ave
- 813 S Fulton Ave
- 755 S Fulton Ave
- 802 Washington Park
- 806 Washington Park
- 802 S Fulton Ave
- 741 S Fulton Ave
- 754 Washington Park
- 808 Washington Park
- 750 S Fulton Ave
- 1709 8th St
- 742 Washington Park
- 823 S Fulton Ave
- 737 S Fulton Ave
- 818 Washington Park
- 814 S Fulton Ave
- 1712 8th St
- 738 Washington Park
- 820 S Fulton Ave
- 1715 8th St