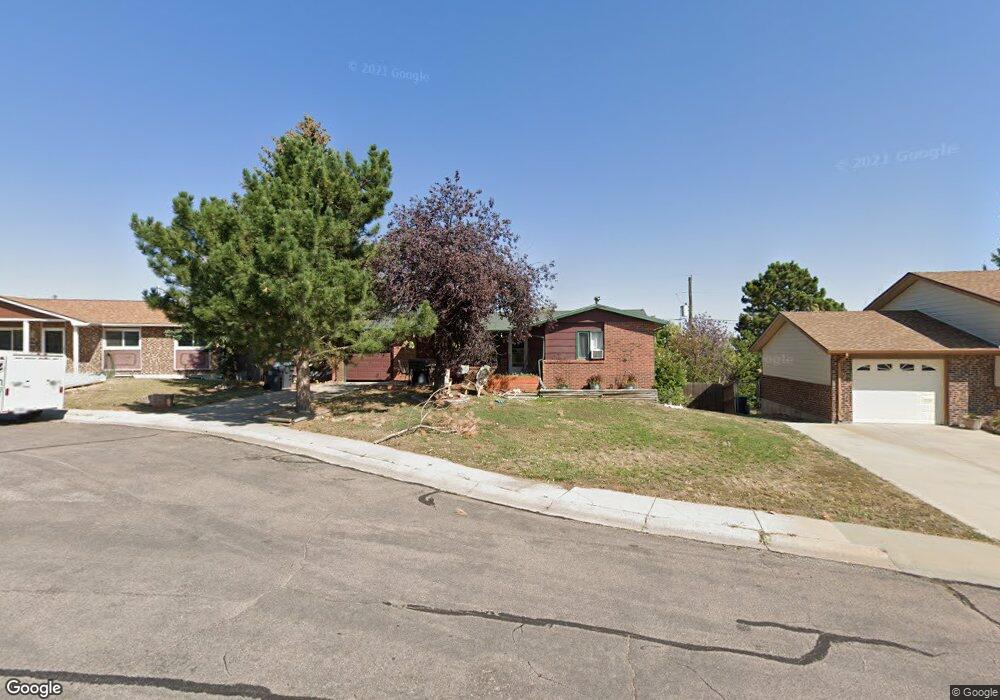
1619 Columbine Ct Cheyenne, WY 82001
Estimated Value: $332,000 - $350,151
--
Bed
--
Bath
1,032
Sq Ft
$330/Sq Ft
Est. Value
About This Home
This home is located at 1619 Columbine Ct, Cheyenne, WY 82001 and is currently estimated at $340,538, approximately $329 per square foot. 1619 Columbine Ct is a home located in Laramie County with nearby schools including Bain Elementary School, Johnson Junior High School, and South High School.
Ownership History
Date
Name
Owned For
Owner Type
Purchase Details
Closed on
May 1, 2006
Sold by
Carter Kimber Lee
Bought by
Carter Susan M
Current Estimated Value
Purchase Details
Closed on
May 4, 2004
Sold by
Carter Kimber L and Hess Kimber L
Bought by
Carter Kimber L
Purchase Details
Closed on
Aug 30, 2001
Sold by
Hess Patrick L
Bought by
Hess Kimber L
Purchase Details
Closed on
Oct 4, 1999
Sold by
Lopez Reynaldo R and Lopez Kathryn A
Bought by
Hess Patrick L and Hess Kimber L
Home Financials for this Owner
Home Financials are based on the most recent Mortgage that was taken out on this home.
Original Mortgage
$94,900
Interest Rate
8.02%
Create a Home Valuation Report for This Property
The Home Valuation Report is an in-depth analysis detailing your home's value as well as a comparison with similar homes in the area
Home Values in the Area
Average Home Value in this Area
Purchase History
| Date | Buyer | Sale Price | Title Company |
|---|---|---|---|
| Carter Susan M | -- | None Available | |
| Carter Kimber L | -- | -- | |
| Hess Kimber L | -- | -- | |
| Hess Patrick L | -- | -- |
Source: Public Records
Mortgage History
| Date | Status | Borrower | Loan Amount |
|---|---|---|---|
| Previous Owner | Hess Patrick L | $94,900 |
Source: Public Records
Tax History Compared to Growth
Tax History
| Year | Tax Paid | Tax Assessment Tax Assessment Total Assessment is a certain percentage of the fair market value that is determined by local assessors to be the total taxable value of land and additions on the property. | Land | Improvement |
|---|---|---|---|---|
| 2025 | $1,939 | $21,283 | $2,786 | $18,497 |
| 2024 | $1,939 | $27,428 | $3,714 | $23,714 |
| 2023 | $1,926 | $27,239 | $3,714 | $23,525 |
| 2022 | $1,825 | $25,284 | $3,714 | $21,570 |
| 2021 | $1,654 | $22,860 | $3,714 | $19,146 |
| 2020 | $1,524 | $21,122 | $3,714 | $17,408 |
| 2019 | $1,401 | $19,405 | $3,714 | $15,691 |
| 2018 | $1,304 | $18,232 | $3,527 | $14,705 |
| 2017 | $1,255 | $17,390 | $2,824 | $14,566 |
| 2016 | $1,209 | $16,752 | $2,784 | $13,968 |
| 2015 | $1,107 | $15,323 | $2,784 | $12,539 |
| 2014 | $1,106 | $15,214 | $2,784 | $12,430 |
Source: Public Records
Map
Nearby Homes
- 4811 E 14th St
- 4701 Long Branch Loop
- 4802 E 13th St
- TBD Taft Ave
- 1809 Copperville Rd
- 1913 Prairie Dog Dr
- 4404 Cottage Ln
- 1720 Maroon Dr
- Tr 3 E Pershing Blvd
- TR 2 E Pershing Blvd
- 4904 E Pershing Blvd
- 1511 Gettysburg Dr
- 1442 Monroe Ct
- 1519 Adams Ave
- 828 Sun Valley Dr
- 5816 Parkside Dr
- 5724 Parkside Dr
- 1309 Diamond Ave
- 1301 Diamond Ave
- Lot 2 E 13th St
- 1613 Columbine Ct
- 1625 Columbine Ct
- 1607 Columbine Ct
- 1604 Taft Ave
- 1516 Taft Ave
- 1616 Columbine Ct
- 4720 E 17th St
- 1610 Taft Ave
- 1510 Taft Ave
- 1601 Columbine Ct
- 4714 E 17th St
- 1610 Columbine Ct
- 1616 Taft Ave
- 4709 E 17th St
- 1604 Columbine Ct
- 4708 E 17th St
- 1515 Columbine Ct
- 1702 Taft Ave
- 4703 E 17th St
- 4703 E 17th St Unit 2