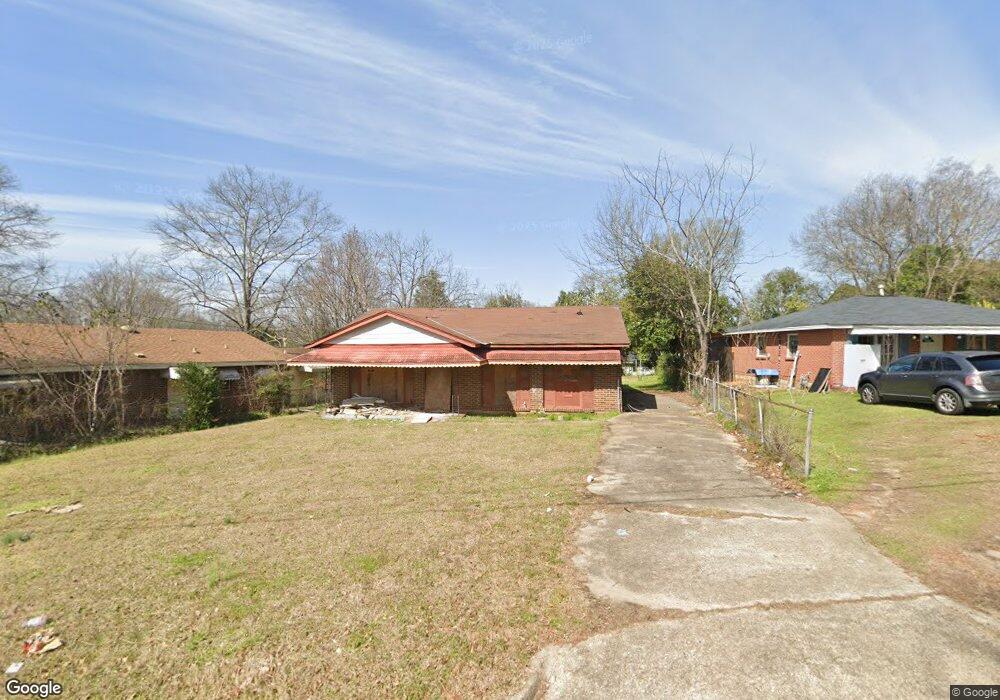
1619 Crouson St Montgomery, AL 36110
North Montgomery NeighborhoodEstimated Value: $50,000 - $54,225
2
Beds
1
Bath
972
Sq Ft
$54/Sq Ft
Est. Value
About This Home
This home is located at 1619 Crouson St, Montgomery, AL 36110 and is currently estimated at $52,806, approximately $54 per square foot. 1619 Crouson St is a home located in Montgomery County with nearby schools including Highland Gardens Elementary School, Capitol Heights Jr High School, and Dr. Percy L. Julian High School.
Ownership History
Date
Name
Owned For
Owner Type
Purchase Details
Closed on
Feb 3, 2025
Sold by
Robinson David
Bought by
Nuckles James A
Current Estimated Value
Purchase Details
Closed on
Jan 10, 2015
Sold by
Defee Terry W
Bought by
Robinson David
Purchase Details
Closed on
Aug 24, 2009
Sold by
King Christine
Bought by
Defee Terry W
Purchase Details
Closed on
Apr 28, 2006
Sold by
B & D Investments Llc
Bought by
King Alicia
Purchase Details
Closed on
Apr 15, 2003
Sold by
Hud
Bought by
B&D Investments Llc
Purchase Details
Closed on
Sep 21, 2000
Sold by
Pre Loved Homes Inc
Bought by
Vickers George E and Vickers Sybil A
Home Financials for this Owner
Home Financials are based on the most recent Mortgage that was taken out on this home.
Original Mortgage
$54,451
Interest Rate
8.05%
Mortgage Type
FHA
Purchase Details
Closed on
Jun 30, 2000
Sold by
Marvin Albert F
Bought by
Pre Loved Homes Inc
Create a Home Valuation Report for This Property
The Home Valuation Report is an in-depth analysis detailing your home's value as well as a comparison with similar homes in the area
Home Values in the Area
Average Home Value in this Area
Purchase History
| Date | Buyer | Sale Price | Title Company |
|---|---|---|---|
| Nuckles James A | $6,500 | None Listed On Document | |
| Nuckles James A | $6,500 | None Listed On Document | |
| Robinson David | $2,500 | None Available | |
| Defee Terry W | -- | None Available | |
| King Alicia | -- | None Available | |
| B&D Investments Llc | $33,500 | -- | |
| Vickers George E | -- | -- | |
| Pre Loved Homes Inc | -- | -- |
Source: Public Records
Mortgage History
| Date | Status | Borrower | Loan Amount |
|---|---|---|---|
| Previous Owner | Vickers George E | $54,451 |
Source: Public Records
Tax History Compared to Growth
Tax History
| Year | Tax Paid | Tax Assessment Tax Assessment Total Assessment is a certain percentage of the fair market value that is determined by local assessors to be the total taxable value of land and additions on the property. | Land | Improvement |
|---|---|---|---|---|
| 2025 | $170 | $3,500 | $1,500 | $2,000 |
| 2024 | $173 | $3,460 | $1,500 | $1,960 |
| 2023 | $173 | $3,280 | $1,500 | $1,780 |
| 2022 | $118 | $3,220 | $1,500 | $1,720 |
| 2021 | $137 | $3,740 | $1,500 | $2,240 |
| 2020 | $137 | $3,740 | $1,500 | $2,240 |
| 2019 | $145 | $3,960 | $1,500 | $2,460 |
| 2018 | $145 | $3,980 | $0 | $0 |
| 2017 | $157 | $4,300 | $1,500 | $2,800 |
| 2014 | $174 | $4,780 | $1,500 | $3,280 |
| 2013 | -- | $4,100 | $1,500 | $2,600 |
Source: Public Records
Map
Nearby Homes
- 1641 N Yarbrough Ct
- 1660 Crouson St
- 1616 Yarbrough St
- 1741 Crouson St
- 15 Broadway St
- 1818 Rigby St
- 1800 Cotton Ct
- 3329 Texas St
- 3137 Texas St
- 12 Pine St
- 3127 Texas St
- 3212 Texas St
- 3025 Baffin Dr
- 1848 Gibson St
- 3452 Harris St
- 1923 Gibson St
- 1805 Texas Ct
- 2925 Lower Wetumpka Rd
- 1818 Austin St
- 1945 Gibson St
- 1623 Crouson St
- 1615 Crouson St
- 1627 Crouson St
- 1600 Champion St
- 1604 Champion St
- 1639 Crouson St
- 1608 Champion St
- 1647 Crouson St Unit 1645
- 1616 Crouson St
- 1620 Crouson St
- 1612 Crouson St
- 1624 Crouson St
- 1612 Champion St
- 1608 Crouson St
- 1628 Crouson St
- 1613 Crouson St
- 1616 Champion St
- 1645 N Yarbrough Ct
- 1620 Champion St
- 1632 Crouson St