Estimated Value: $396,706 - $412,000
3
Beds
3
Baths
1,563
Sq Ft
$258/Sq Ft
Est. Value
About This Home
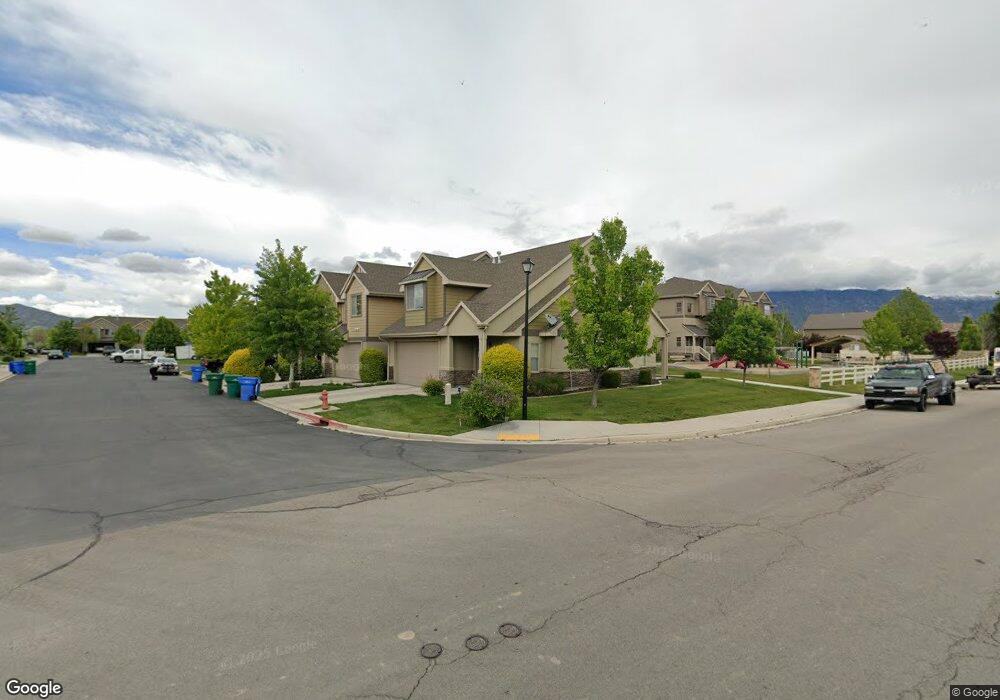
This home is located at 1619 S 530 E, Lehi, UT 84043 and is currently estimated at $403,902, approximately $258 per square foot. 1619 S 530 E is a home located in Utah County with nearby schools including Dry Creek Elementary School, Lehi Junior High School, and Lehi High School.
Ownership History
Date
Name
Owned For
Owner Type
Purchase Details
Closed on
Jan 29, 2018
Sold by
Barker James and Barker Sandee L
Bought by
Alpine Capital Partners Llc
Current Estimated Value
Home Financials for this Owner
Home Financials are based on the most recent Mortgage that was taken out on this home.
Original Mortgage
$179,925
Outstanding Balance
$152,188
Interest Rate
3.94%
Mortgage Type
Commercial
Estimated Equity
$251,714
Purchase Details
Closed on
Aug 12, 2015
Sold by
Puleri Richard
Bought by
Barker James and Smith Sandee L
Home Financials for this Owner
Home Financials are based on the most recent Mortgage that was taken out on this home.
Original Mortgage
$201,031
Interest Rate
4.05%
Mortgage Type
VA
Purchase Details
Closed on
Apr 27, 2006
Sold by
Building Dynamics Inc
Bought by
Puleri Richard
Create a Home Valuation Report for This Property
The Home Valuation Report is an in-depth analysis detailing your home's value as well as a comparison with similar homes in the area
Home Values in the Area
Average Home Value in this Area
Purchase History
| Date | Buyer | Sale Price | Title Company |
|---|---|---|---|
| Alpine Capital Partners Llc | -- | First American Title Ins Co | |
| Barker James | -- | Keystone Title Ins Agen | |
| Puleri Richard | -- | Integrated Title Insurance | |
| Building Dynamics Inc | -- | Integrated Title Insurance |
Source: Public Records
Mortgage History
| Date | Status | Borrower | Loan Amount |
|---|---|---|---|
| Open | Alpine Capital Partners Llc | $179,925 | |
| Previous Owner | Barker James | $201,031 |
Source: Public Records
Tax History
| Year | Tax Paid | Tax Assessment Tax Assessment Total Assessment is a certain percentage of the fair market value that is determined by local assessors to be the total taxable value of land and additions on the property. | Land | Improvement |
|---|---|---|---|---|
| 2025 | $1,753 | $205,205 | -- | -- |
| 2024 | $1,753 | $205,205 | $0 | $0 |
| 2023 | $1,570 | $199,485 | $0 | $0 |
| 2022 | $1,668 | $205,480 | $0 | $0 |
| 2021 | $1,508 | $280,900 | $42,100 | $238,800 |
| 2020 | $1,426 | $262,500 | $39,400 | $223,100 |
| 2019 | $1,306 | $250,000 | $37,500 | $212,500 |
| 2018 | $1,205 | $218,000 | $32,700 | $185,300 |
| 2017 | $1,132 | $108,900 | $0 | $0 |
| 2016 | $1,159 | $103,400 | $0 | $0 |
| 2015 | $1,221 | $103,400 | $0 | $0 |
| 2014 | $1,091 | $91,850 | $0 | $0 |
Source: Public Records
Map
Nearby Homes
Your Personal Tour Guide
Ask me questions while you tour the home.