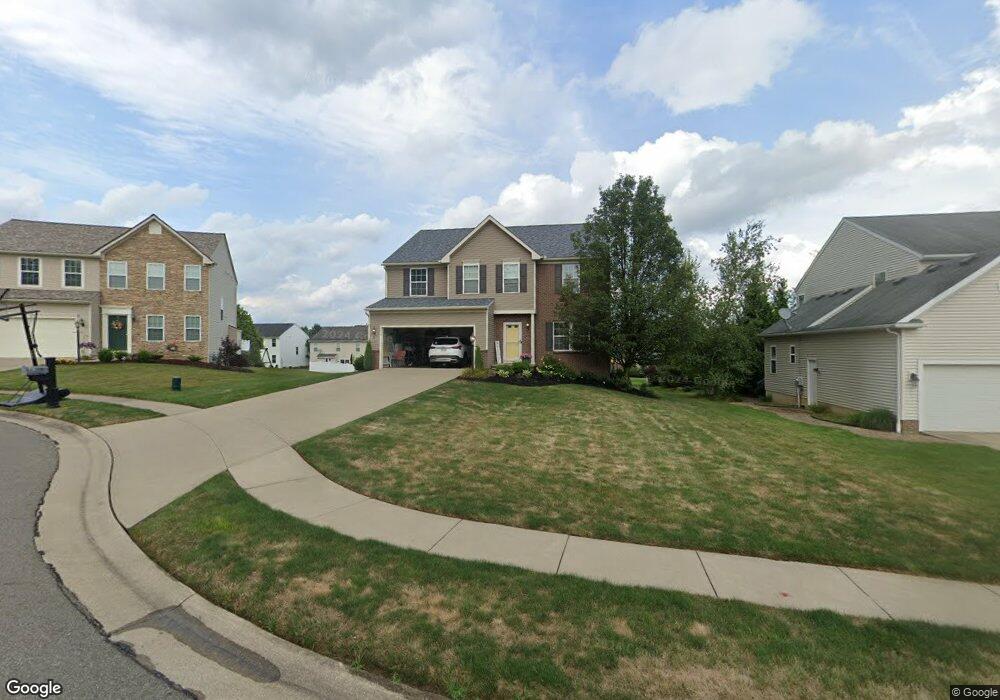
1619 Seabiscuit St NE Canton, OH 44721
Estimated Value: $351,000 - $438,000
4
Beds
3
Baths
3,276
Sq Ft
$124/Sq Ft
Est. Value
About This Home
This home is located at 1619 Seabiscuit St NE, Canton, OH 44721 and is currently estimated at $407,380, approximately $124 per square foot. 1619 Seabiscuit St NE is a home located in Stark County with nearby schools including Middlebranch Elementary School, Oakwood Middle School, and GlenOak High School.
Ownership History
Date
Name
Owned For
Owner Type
Purchase Details
Closed on
Jan 23, 2019
Sold by
Kasper Eric
Bought by
Kasper Jennifer and Fisher Jennifer
Current Estimated Value
Home Financials for this Owner
Home Financials are based on the most recent Mortgage that was taken out on this home.
Original Mortgage
$103,000
Outstanding Balance
$63,970
Interest Rate
3.6%
Mortgage Type
New Conventional
Estimated Equity
$343,410
Purchase Details
Closed on
May 13, 2009
Sold by
Nvr Inc
Bought by
Fisher Jennifer and Kasper Eric
Home Financials for this Owner
Home Financials are based on the most recent Mortgage that was taken out on this home.
Original Mortgage
$175,300
Interest Rate
4.83%
Mortgage Type
Purchase Money Mortgage
Purchase Details
Closed on
Mar 16, 2009
Sold by
Wagler Homes Of Akron Inc
Bought by
Nvr Inc and Ryan Homes
Home Financials for this Owner
Home Financials are based on the most recent Mortgage that was taken out on this home.
Original Mortgage
$175,300
Interest Rate
4.83%
Mortgage Type
Purchase Money Mortgage
Create a Home Valuation Report for This Property
The Home Valuation Report is an in-depth analysis detailing your home's value as well as a comparison with similar homes in the area
Home Values in the Area
Average Home Value in this Area
Purchase History
| Date | Buyer | Sale Price | Title Company |
|---|---|---|---|
| Kasper Jennifer | -- | Third Capital Title | |
| Fisher Jennifer | $219,200 | Nvr Title Agency Llc | |
| Nvr Inc | $35,000 | None Available |
Source: Public Records
Mortgage History
| Date | Status | Borrower | Loan Amount |
|---|---|---|---|
| Open | Kasper Jennifer | $103,000 | |
| Closed | Fisher Jennifer | $175,300 |
Source: Public Records
Tax History Compared to Growth
Tax History
| Year | Tax Paid | Tax Assessment Tax Assessment Total Assessment is a certain percentage of the fair market value that is determined by local assessors to be the total taxable value of land and additions on the property. | Land | Improvement |
|---|---|---|---|---|
| 2025 | -- | $128,030 | $29,680 | $98,350 |
| 2024 | -- | $128,030 | $29,680 | $98,350 |
| 2023 | $4,480 | $94,930 | $23,070 | $71,860 |
| 2022 | $4,477 | $94,930 | $23,070 | $71,860 |
| 2021 | $4,466 | $94,930 | $23,070 | $71,860 |
| 2020 | $4,608 | $89,150 | $20,970 | $68,180 |
| 2019 | $4,572 | $89,150 | $20,970 | $68,180 |
| 2018 | $4,528 | $89,150 | $20,970 | $68,180 |
| 2017 | $4,787 | $86,320 | $18,590 | $67,730 |
| 2016 | $4,805 | $86,320 | $18,590 | $67,730 |
| 2015 | $4,656 | $86,320 | $18,590 | $67,730 |
| 2014 | $1,819 | $68,960 | $15,090 | $53,870 |
| 2013 | $1,860 | $68,960 | $15,090 | $53,870 |
Source: Public Records
Map
Nearby Homes
- 1627 Seabiscuit Dr NE
- 1614 Bellview St NE
- 6464 Harness Cir NE
- 1563 Bellview St NE
- 6650 Harvest Ridge Ave NE
- 1544 Gate House St NE
- 1404 Southbrook Cir NE
- 6824 Birchbark Ave NE
- Cumberland Plan at Fountains at Edgewood
- Roanoke Plan at Fountains at Edgewood
- Lehigh w/ 3-Car Garage Plan at Fountains at Edgewood
- Powell Plan at Fountains at Edgewood
- 2044 Longfellow St NE
- 6831 Harrington Court Ave NE
- 7071 Fenwick Ave NE
- 717 Easton St NE
- 6816 Harrington Court Ave NE
- 1369 Gate House NE
- 6654 Windgate Ave NE
- 2218 Hiddenbrook St NE
- 1627 Seabiscuit St NE
- 1613 Seabiscuit St NE
- 1639 Seabiscuit Dr NE
- 6477 Pine Bluff Ave NE
- 6483 Pine Bluff Ave NE
- 6469 Pine Bluff Ave NE
- 6491 Pine Bluff Ave NE
- 6461 Pine Bluff Ave NE
- 1624 Seabiscuit St NE
- 1653 Seabiscuit Dr NE
- 6499 Pine Bluff Ave NE
- 1616 Seabiscuit St NE
- 1636 Seabiscuit Dr NE
- 1636 Seabiscuit St NE
- 1612 Seabiscuit Dr NE
- 6457 Pine Bluff Ave NE
- 6505 Pine Bluff Ave NE
- 1669 Seabiscuit St NE
- 1669 Seabiscuit Dr NE
- 6449 Pine Bluff Ave NE