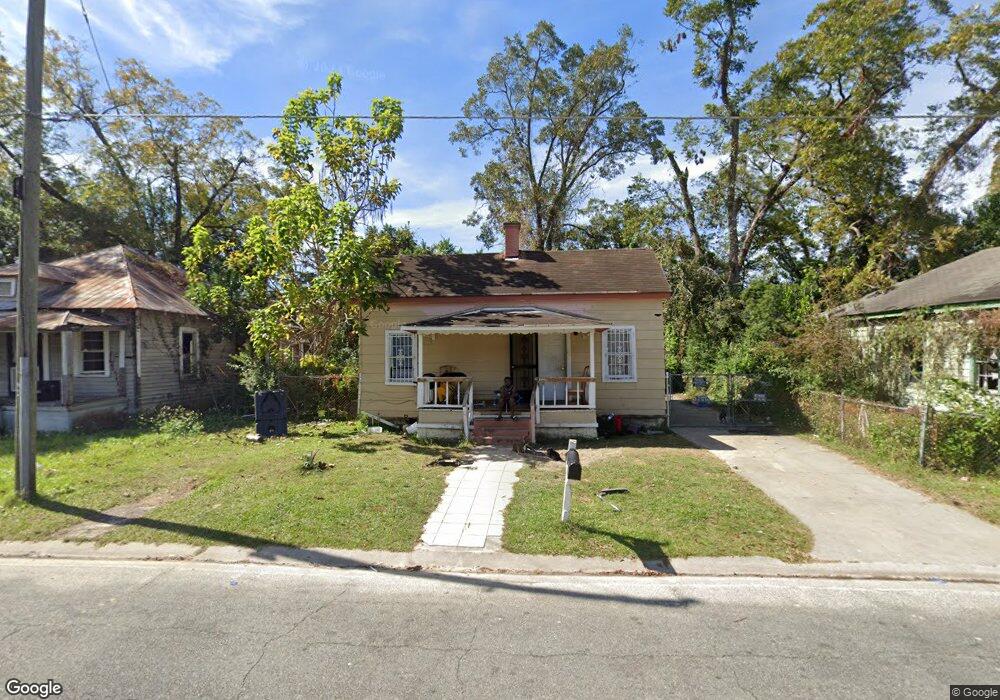
1619 Thomas St Waycross, GA 31501
Estimated Value: $64,000 - $115,000
2
Beds
1
Bath
800
Sq Ft
$101/Sq Ft
Est. Value
About This Home
This home is located at 1619 Thomas St, Waycross, GA 31501 and is currently estimated at $80,957, approximately $101 per square foot. 1619 Thomas St is a home located in Ware County with nearby schools including Wacona Elementary School, Ware County Middle School, and Ware County High School.
Ownership History
Date
Name
Owned For
Owner Type
Purchase Details
Closed on
Nov 28, 2006
Sold by
Dixie Heritage Investments
Bought by
Riechert Theresia
Current Estimated Value
Purchase Details
Closed on
Sep 11, 2006
Sold by
Giddens Mahala Elizabeth
Bought by
Giddens Gregory Benjamin
Purchase Details
Closed on
Jun 13, 2006
Sold by
Curry Roger Lewis
Bought by
Dixie Heritage Investments Llc
Purchase Details
Closed on
Apr 16, 2003
Sold by
Carter Andrew
Bought by
Curry Roger Lewis
Purchase Details
Closed on
Sep 5, 2002
Sold by
Carter Zernona Ann
Bought by
Carter Andrew
Purchase Details
Closed on
Jun 20, 2002
Sold by
Carter Zernona Ann
Bought by
Carter Andrew
Purchase Details
Closed on
Jun 17, 2002
Sold by
Carter Zernona Ann
Bought by
Carter Andrew
Create a Home Valuation Report for This Property
The Home Valuation Report is an in-depth analysis detailing your home's value as well as a comparison with similar homes in the area
Home Values in the Area
Average Home Value in this Area
Purchase History
| Date | Buyer | Sale Price | Title Company |
|---|---|---|---|
| Riechert Theresia | $15,000 | -- | |
| Giddens Gregory Benjamin | -- | -- | |
| Dixie Heritage Investments Llc | $6,000 | -- | |
| Curry Roger Lewis | $13,000 | -- | |
| Carter Andrew | -- | -- | |
| Carter Andrew | -- | -- | |
| Carter Andrew | -- | -- |
Source: Public Records
Tax History Compared to Growth
Tax History
| Year | Tax Paid | Tax Assessment Tax Assessment Total Assessment is a certain percentage of the fair market value that is determined by local assessors to be the total taxable value of land and additions on the property. | Land | Improvement |
|---|---|---|---|---|
| 2024 | $397 | $11,351 | $1,200 | $10,151 |
| 2023 | $391 | $8,798 | $452 | $8,346 |
| 2022 | $351 | $8,798 | $452 | $8,346 |
| 2021 | $296 | $6,853 | $452 | $6,401 |
| 2020 | $294 | $6,738 | $452 | $6,286 |
| 2019 | $290 | $6,566 | $452 | $6,114 |
| 2018 | $280 | $6,278 | $452 | $5,826 |
| 2017 | $280 | $6,422 | $452 | $5,970 |
| 2016 | $280 | $6,422 | $452 | $5,970 |
| 2015 | $282 | $6,422 | $452 | $5,970 |
| 2014 | $282 | $6,422 | $452 | $5,970 |
| 2013 | -- | $6,422 | $452 | $5,970 |
Source: Public Records
Map
Nearby Homes
- 1621 Thomas St
- 1617 Thomas St
- 1623 Thomas St
- 1632 Abc Ave
- 1615 Thomas St
- 1628 Abc Ave
- 1634 Abc Ave
- 1625 Thomas St
- 1622 Abc Ave
- 1638 Abc Ave
- 1627 Thomas St
- 1605 Thomas St
- 1610 Martin Luther King Dr
- 1604 Abc Ave
- 1606 Thomas St
- 1612 Martin Luther King Dr
- 1505 Martin Luther King Dr
- 1603 Thomas St
- 1205 James St
- 1506 Martin Luther King Dr