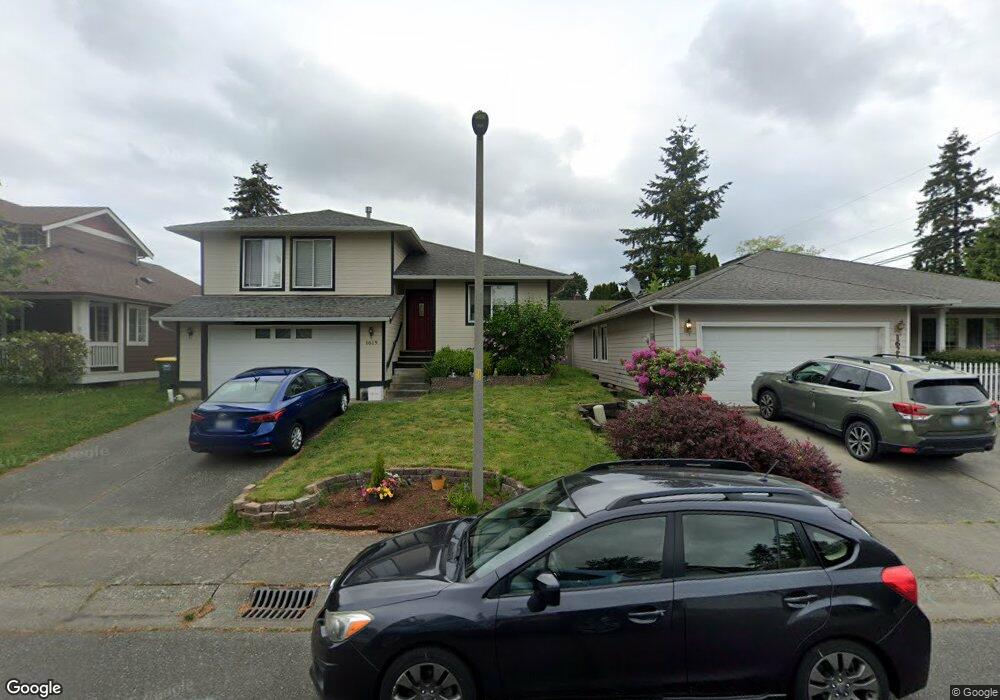
1619 Valhalla St Bellingham, WA 98226
Roosevelt NeighborhoodEstimated Value: $609,976 - $660,000
3
Beds
3
Baths
1,586
Sq Ft
$405/Sq Ft
Est. Value
About This Home
This home is located at 1619 Valhalla St, Bellingham, WA 98226 and is currently estimated at $641,744, approximately $404 per square foot. 1619 Valhalla St is a home located in Whatcom County with nearby schools including Sunnyland Elementary School, Shuksan Middle School, and Squalicum High School.
Ownership History
Date
Name
Owned For
Owner Type
Purchase Details
Closed on
May 23, 2003
Sold by
Nordyke Mark Allen and Nordyke Rebecca A
Bought by
Watters Cameron S and Watters Elizabeth L
Current Estimated Value
Home Financials for this Owner
Home Financials are based on the most recent Mortgage that was taken out on this home.
Original Mortgage
$174,600
Outstanding Balance
$75,663
Interest Rate
5.75%
Mortgage Type
Purchase Money Mortgage
Estimated Equity
$566,081
Purchase Details
Closed on
Mar 21, 2001
Sold by
Carson Seth J and Carson Elna C
Bought by
Nordyke Mark Allen and Nordyke Rebecca A
Home Financials for this Owner
Home Financials are based on the most recent Mortgage that was taken out on this home.
Original Mortgage
$140,298
Interest Rate
6.97%
Mortgage Type
FHA
Purchase Details
Closed on
Oct 22, 1999
Sold by
Huggins Richard and Huggins Phyllis
Bought by
Carson Seth J and Carson Elna C
Home Financials for this Owner
Home Financials are based on the most recent Mortgage that was taken out on this home.
Original Mortgage
$100,000
Interest Rate
7.86%
Mortgage Type
Balloon
Create a Home Valuation Report for This Property
The Home Valuation Report is an in-depth analysis detailing your home's value as well as a comparison with similar homes in the area
Home Values in the Area
Average Home Value in this Area
Purchase History
| Date | Buyer | Sale Price | Title Company |
|---|---|---|---|
| Watters Cameron S | $180,000 | Whatcom Land Title | |
| Nordyke Mark Allen | $142,500 | Whatcom Land Title | |
| Carson Seth J | $135,000 | Island Title |
Source: Public Records
Mortgage History
| Date | Status | Borrower | Loan Amount |
|---|---|---|---|
| Open | Watters Cameron S | $174,600 | |
| Previous Owner | Nordyke Mark Allen | $140,298 | |
| Previous Owner | Carson Seth J | $100,000 |
Source: Public Records
Tax History Compared to Growth
Tax History
| Year | Tax Paid | Tax Assessment Tax Assessment Total Assessment is a certain percentage of the fair market value that is determined by local assessors to be the total taxable value of land and additions on the property. | Land | Improvement |
|---|---|---|---|---|
| 2024 | $4,631 | $580,181 | $223,213 | $356,968 |
| 2023 | $4,631 | $594,918 | $228,883 | $366,035 |
| 2022 | $3,781 | $512,869 | $197,316 | $315,553 |
| 2021 | $3,709 | $407,039 | $156,600 | $250,439 |
| 2020 | $3,636 | $376,888 | $145,000 | $231,888 |
| 2019 | $3,255 | $357,105 | $116,459 | $240,646 |
| 2018 | $3,278 | $320,546 | $104,559 | $215,987 |
| 2017 | $2,829 | $275,981 | $90,020 | $185,961 |
| 2016 | $2,475 | $248,899 | $80,780 | $168,119 |
| 2015 | $2,427 | $226,668 | $73,780 | $152,888 |
| 2014 | -- | $215,055 | $70,000 | $145,055 |
| 2013 | -- | $216,139 | $68,250 | $147,889 |
Source: Public Records
Map
Nearby Homes
- 1735 Sunup Loop
- 1737 Sunup Loop
- 1733 Sunup Loop
- 1712 Sunup Loop
- 1714 Sunup Loop
- 1716 Sunup Loop
- 2602 Woburn St
- 2330 Verona St
- 2325 Valencia St
- 2312 Orleans St
- 2409 Xenia St
- 2316 Xenia St
- 2735 Michigan St
- 2935 King St
- 2138 Woburn St
- 3374 Southbend Place Unit 101
- 1825 E Sunset Dr
- 950 Yew St
- 2432 Grant St
- 2413 E Sunset Dr
- 1731 Sunup Loop
- 1739 Sunup Loop
- 1727 Sunup Loop
- 1725 Sunup Loop
- 1621 Valhalla St
- 1617 Valhalla St
- 2733 St Paul St
- 1615 Valhalla St
- 1706 Valhalla St
- 2735 St Paul St
- 1618 Valhalla St
- 1613 Valhalla St
- 1620 Valhalla St
- 1616 Valhalla St
- 1614 Valhalla St
- 2739 St Paul St
- 2720 Saint Paul St
- 2705 St Paul St
- 1701 Valhalla Ln
- 1701 Valhalla Ln Unit C