16196 Edgington Rd Williamsburg, OH 45176
Estimated Value: $95,000 - $246,000
2
Beds
1
Bath
1,600
Sq Ft
$127/Sq Ft
Est. Value
About This Home
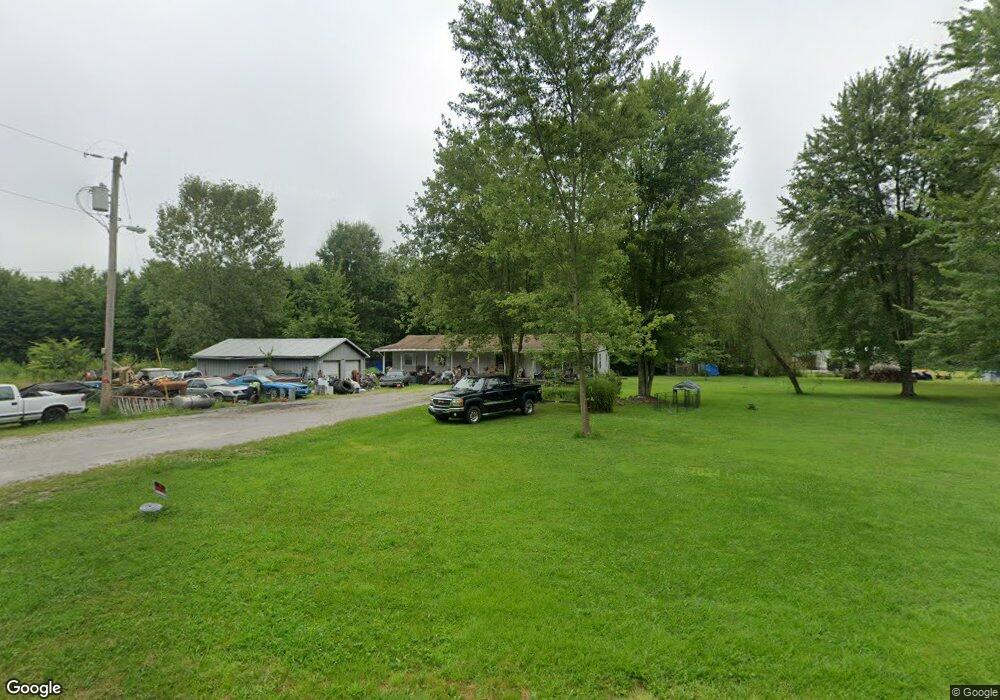
This home is located at 16196 Edgington Rd, Williamsburg, OH 45176 and is currently estimated at $202,606, approximately $126 per square foot. 16196 Edgington Rd is a home located in Brown County with nearby schools including Western Brown High School.
Ownership History
Date
Name
Owned For
Owner Type
Purchase Details
Closed on
Jan 28, 2023
Sold by
Barbula Properties Llc
Bought by
Smith Fred and Brown Michelle
Current Estimated Value
Purchase Details
Closed on
Jun 4, 2011
Sold by
Barbula Properties Llc
Bought by
Smith Fred and Brown Michelle
Purchase Details
Closed on
Jan 25, 2011
Sold by
Grant Barbara A and Grant Barb A
Bought by
Barbula Properties Llc
Purchase Details
Closed on
Feb 2, 2006
Sold by
Fannie Mae
Bought by
Grant Barbara A
Purchase Details
Closed on
Nov 24, 2004
Sold by
Saylor Danny R
Bought by
Fanniemae and Federal National Mortgage Association
Purchase Details
Closed on
Sep 5, 2002
Sold by
Fairbanks Capital Corp
Bought by
Saylor Danny R
Purchase Details
Closed on
Feb 22, 2002
Sold by
Shrf David F Malott Pr
Bought by
Altegra Credit Co
Create a Home Valuation Report for This Property
The Home Valuation Report is an in-depth analysis detailing your home's value as well as a comparison with similar homes in the area
Purchase History
| Date | Buyer | Sale Price | Title Company |
|---|---|---|---|
| Smith Fred | $78,000 | -- | |
| Smith Fred | -- | None Available | |
| Barbula Properties Llc | -- | Attorney | |
| Grant Barbara A | $50,000 | Title First Agency Inc | |
| Fanniemae | $50,000 | -- | |
| Saylor Danny R | $65,000 | -- | |
| Altegra Credit Co | $39,333 | -- |
Source: Public Records
Mortgage History
| Date | Status | Borrower | Loan Amount |
|---|---|---|---|
| Closed | Saylor Danny R | -- |
Source: Public Records
Tax History
| Year | Tax Paid | Tax Assessment Tax Assessment Total Assessment is a certain percentage of the fair market value that is determined by local assessors to be the total taxable value of land and additions on the property. | Land | Improvement |
|---|---|---|---|---|
| 2024 | $1,344 | $46,170 | $7,040 | $39,130 |
| 2023 | $1,344 | $35,910 | $5,570 | $30,340 |
| 2022 | $1,109 | $35,910 | $5,570 | $30,340 |
| 2021 | $1,096 | $35,910 | $5,570 | $30,340 |
| 2020 | $950 | $29,920 | $4,640 | $25,280 |
| 2019 | $1,019 | $29,920 | $4,640 | $25,280 |
| 2018 | $506 | $29,920 | $4,640 | $25,280 |
| 2017 | $926 | $27,050 | $4,640 | $22,410 |
| 2016 | $926 | $27,050 | $4,640 | $22,410 |
| 2015 | $910 | $27,050 | $4,640 | $22,410 |
| 2014 | $918 | $26,630 | $4,220 | $22,410 |
| 2013 | $915 | $26,630 | $4,220 | $22,410 |
Source: Public Records
Map
Nearby Homes
- 2097 Greenbush West Rd
- 4540 Ireton Rd
- 1 Greenbush West Rd
- 15270 Karampas Ln
- 3717 Cobb Rd
- Acres Dela Palma Rd
- 0 Steward Harbough Rd Unit 1839956
- 15768 Bodman Rd
- 3518 Island Trail Dr
- 0 Bodman Rd Unit 1862655
- 0 Valerie Ln Unit 1862359
- 15070 Bodman Rd
- 2079 Old State Rd
- 1780 Martinique Dr
- 126 Cornerstone Dr
- 124 Cornerstone Dr
- 122 Cornerstone Dr
- 120 Cornerstone Dr
- 114 Cornerstone Dr
- 115 Cornerstone Dr
- 16222 Edgington Rd
- 16168 Edgington Rd
- 16193 Sams Dr
- 16221 Sams Dr
- 16204 Sams Dr
- 16118 Edgington Rd
- 16214 Sams Dr
- 1673 Stephanie Dr
- 16165 Edington Rd
- 16165 Edington Rd
- 16127 Edgington Rd
- 16229 Edgington Rd
- 16265 Edgington Rd
- 16087 Edgington Rd
- 1698 Laurie St
- 1731 Stephanie Dr
- 16283 Edgington Rd
- 16303 Edgington Rd
- 16259 Edgington Rd
- 1742 Laurie St
Your Personal Tour Guide
Ask me questions while you tour the home.