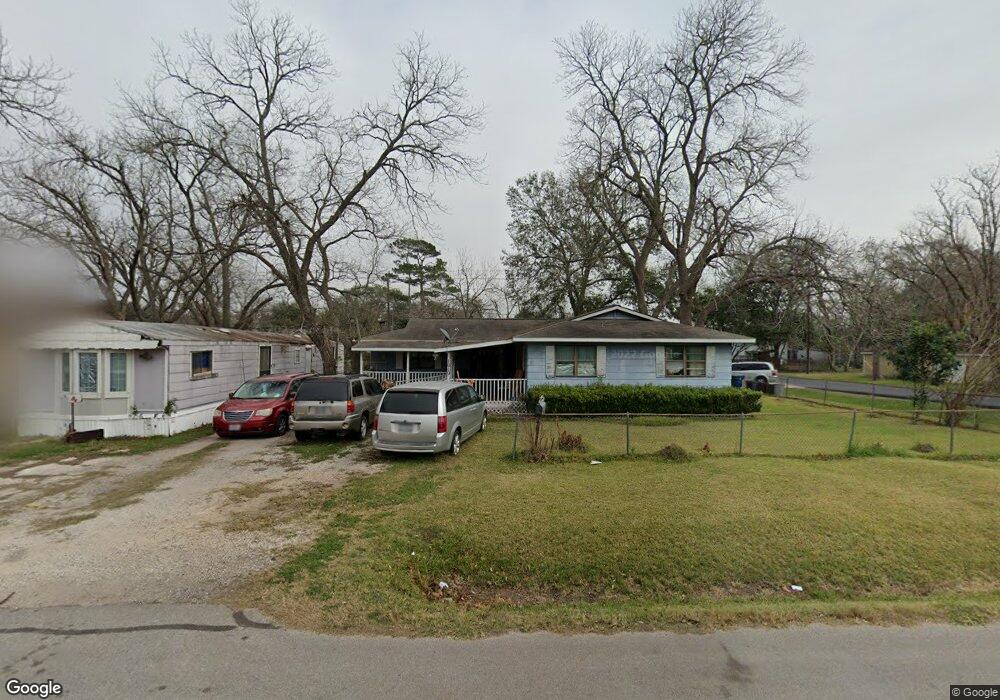
1619R 6th St Rosenberg, TX 77471
Estimated Value: $139,031 - $204,000
2
Beds
1
Bath
896
Sq Ft
$196/Sq Ft
Est. Value
About This Home
This home is located at 1619R 6th St, Rosenberg, TX 77471 and is currently estimated at $175,758, approximately $196 per square foot. 1619R 6th St is a home located in Fort Bend County with nearby schools including Taylor Ray Elementary School, Navarro Middle School, and George Junior High School.
Ownership History
Date
Name
Owned For
Owner Type
Purchase Details
Closed on
Jan 24, 2005
Sold by
Palmarez Andy
Bought by
Palmarez Adela C
Current Estimated Value
Purchase Details
Closed on
Jan 21, 2005
Sold by
Palmarez Andrew
Bought by
Palmarez Adela C
Purchase Details
Closed on
Jun 3, 1990
Sold by
Palmarez Andrew L and Palmarez Adela C
Bought by
Palmarez Adela C
Create a Home Valuation Report for This Property
The Home Valuation Report is an in-depth analysis detailing your home's value as well as a comparison with similar homes in the area
Home Values in the Area
Average Home Value in this Area
Purchase History
| Date | Buyer | Sale Price | Title Company |
|---|---|---|---|
| Palmarez Adela C | -- | Fidelity National Title | |
| Palmarez Adela C | -- | Fidelity National Title | |
| Palmarez Adela C | -- | Fidelity National Title | |
| Palmarez Adela C | -- | Fidelity National Title | |
| Palmarez Adela C | -- | -- |
Source: Public Records
Tax History Compared to Growth
Tax History
| Year | Tax Paid | Tax Assessment Tax Assessment Total Assessment is a certain percentage of the fair market value that is determined by local assessors to be the total taxable value of land and additions on the property. | Land | Improvement |
|---|---|---|---|---|
| 2025 | $2,428 | $109,959 | $51,678 | $58,281 |
| 2024 | $2,428 | $128,528 | $51,678 | $76,850 |
| 2023 | $2,275 | $117,869 | $40,534 | $77,335 |
| 2022 | $2,063 | $100,700 | $40,530 | $60,170 |
| 2021 | $1,501 | $72,330 | $36,290 | $36,040 |
| 2020 | $1,528 | $72,000 | $35,850 | $36,150 |
| 2019 | $1,304 | $57,100 | $20,930 | $36,170 |
| 2018 | $1,235 | $53,200 | $20,930 | $32,270 |
| 2017 | $1,042 | $44,630 | $20,930 | $23,700 |
| 2016 | $869 | $37,240 | $20,930 | $16,310 |
| 2015 | $882 | $37,580 | $20,930 | $16,650 |
| 2014 | $893 | $37,590 | $20,930 | $16,660 |
Source: Public Records
Map
Nearby Homes