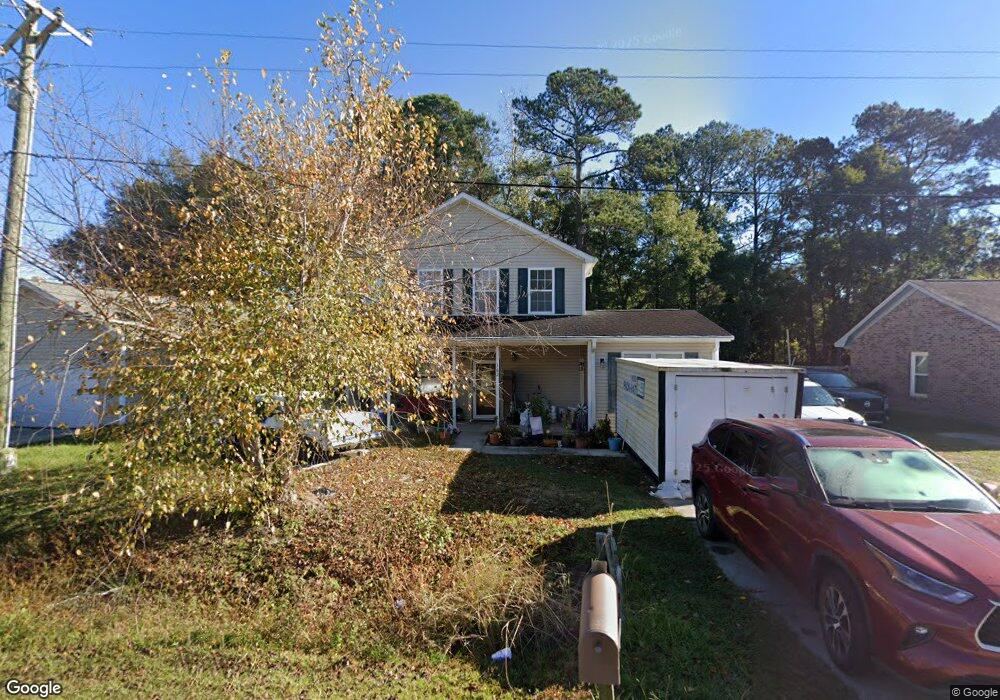
162 Charles B Gibson Ave Unit 1 Goose Creek, SC 29445
Estimated Value: $289,000 - $322,000
3
Beds
3
Baths
1,456
Sq Ft
$206/Sq Ft
Est. Value
About This Home
This home is located at 162 Charles B Gibson Ave Unit 1, Goose Creek, SC 29445 and is currently estimated at $300,034, approximately $206 per square foot. 162 Charles B Gibson Ave Unit 1 is a home located in Berkeley County with nearby schools including Mount Holly Elementary, Sedgefield Middle School, and Goose Creek High School.
Ownership History
Date
Name
Owned For
Owner Type
Purchase Details
Closed on
Aug 26, 2021
Sold by
Valdez Shelly D
Bought by
Valdez Orlando J
Current Estimated Value
Home Financials for this Owner
Home Financials are based on the most recent Mortgage that was taken out on this home.
Original Mortgage
$134,709
Interest Rate
3.09%
Mortgage Type
FHA
Purchase Details
Closed on
Mar 31, 2015
Sold by
Vick John C
Bought by
Valdez Orlando J and Valdez Shelly D
Home Financials for this Owner
Home Financials are based on the most recent Mortgage that was taken out on this home.
Original Mortgage
$133,536
Interest Rate
3.87%
Mortgage Type
FHA
Purchase Details
Closed on
Jan 11, 2013
Sold by
Vick Karen Irene Thal
Bought by
Vick John C
Purchase Details
Closed on
Jun 10, 2003
Sold by
O S Builders Inc
Bought by
Vick John C
Purchase Details
Closed on
Jun 21, 2002
Sold by
Lane Regina
Bought by
O S Builders Inc
Create a Home Valuation Report for This Property
The Home Valuation Report is an in-depth analysis detailing your home's value as well as a comparison with similar homes in the area
Home Values in the Area
Average Home Value in this Area
Purchase History
| Date | Buyer | Sale Price | Title Company |
|---|---|---|---|
| Valdez Orlando J | -- | Mortgage Connect Lp | |
| Valdez Orlando J | -- | Srivastava Jane | |
| Valdez Orlando J | $136,000 | -- | |
| Vick John C | -- | -- | |
| Vick John C | $112,000 | -- | |
| O S Builders Inc | $10,000 | -- |
Source: Public Records
Mortgage History
| Date | Status | Borrower | Loan Amount |
|---|---|---|---|
| Previous Owner | Valdez Orlando J | $134,709 | |
| Previous Owner | Valdez Orlando J | $133,536 |
Source: Public Records
Tax History Compared to Growth
Tax History
| Year | Tax Paid | Tax Assessment Tax Assessment Total Assessment is a certain percentage of the fair market value that is determined by local assessors to be the total taxable value of land and additions on the property. | Land | Improvement |
|---|---|---|---|---|
| 2025 | $2,786 | $173,909 | $49,209 | $124,700 |
| 2024 | $2,786 | $10,435 | $2,953 | $7,482 |
| 2023 | $2,786 | $10,435 | $2,953 | $7,482 |
| 2022 | $2,673 | $9,073 | $1,488 | $7,585 |
| 2021 | $915 | $6,050 | $992 | $5,057 |
| 2020 | $925 | $6,049 | $992 | $5,057 |
| 2019 | $920 | $6,049 | $992 | $5,057 |
| 2018 | $852 | $5,260 | $1,200 | $4,060 |
| 2017 | $793 | $5,260 | $1,200 | $4,060 |
| 2016 | $809 | $5,260 | $1,200 | $4,060 |
| 2015 | $700 | $4,990 | $1,200 | $3,790 |
| 2014 | $689 | $4,750 | $1,200 | $3,550 |
| 2013 | -- | $4,750 | $1,200 | $3,550 |
Source: Public Records
Map
Nearby Homes
- 162 Charles B Gibson Ave
- 123 Millburn Ave
- 429 Rubyridge Ln
- 19 Glenville Ave
- 304 Bremerton Dr
- 13 Rumson Rd
- 154 Rahway Rd Unit H
- 300 Bremerton Dr
- 326 Bremerton Dr
- Foster II Plan at Windward Townes
- 306 Bremerton Dr
- 362 Bremerton Dr
- 356 Bremerton Dr
- 358 Bremerton Dr
- 112 Roselle Ave
- 5 Summit Ave
- 58 Princeton Rd
- 30 Oak Grove Rd
- 25 Delaware Rd
- 540 Truman Dr
- 162 Charles B Gibson Blvd
- 160 Charles B Gibson Blvd
- 164 Charles B Gibson Blvd
- 158 Charles B Gibson Blvd
- 158 Charles B Gibson Ave
- 166 Charles B Gibson Blvd
- 141 Summit Ave
- 143 Summit Ave
- 166 Charles B Gibson Ave
- 139 Summit Ave
- 145 Summit Ave
- 156 Charles B Gibson Blvd
- 156 Charles B Gibson Ave
- 137 Summit Ave
- 135 Summit Ave
- 147 Summit Ave
- 140 Summit Ave
- 142 Summit Ave
- 144 Summit Ave
- 133 Summit Ave