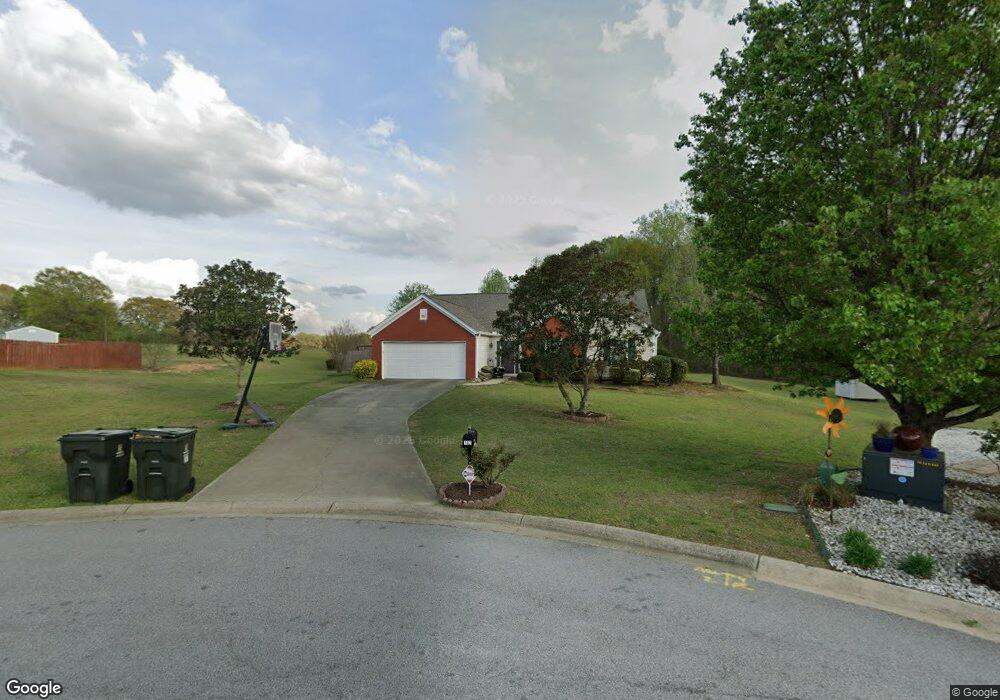
162 Crestworth Place Unit 4 Powder Springs, GA 30127
Estimated Value: $341,922 - $372,000
3
Beds
2
Baths
2,024
Sq Ft
$175/Sq Ft
Est. Value
About This Home
This home is located at 162 Crestworth Place Unit 4, Powder Springs, GA 30127 and is currently estimated at $354,731, approximately $175 per square foot. 162 Crestworth Place Unit 4 is a home located in Paulding County with nearby schools including Bessie L. Baggett Elementary School, J. A. Dobbins Middle School, and Hiram High School.
Ownership History
Date
Name
Owned For
Owner Type
Purchase Details
Closed on
Aug 26, 2016
Sold by
Patrick
Bought by
Hurd Margaret M
Current Estimated Value
Home Financials for this Owner
Home Financials are based on the most recent Mortgage that was taken out on this home.
Original Mortgage
$114,400
Outstanding Balance
$91,525
Interest Rate
3.48%
Estimated Equity
$263,206
Purchase Details
Closed on
Mar 6, 2012
Sold by
Mathews Alicia M
Bought by
Deutsche Bank National Trust C
Purchase Details
Closed on
May 22, 2010
Sold by
Hurd Robert H
Purchase Details
Closed on
May 21, 2010
Sold by
Hurd Robert H
Purchase Details
Closed on
Oct 11, 1999
Sold by
Batesville Construction Inc
Bought by
Patrick Frederick D
Home Financials for this Owner
Home Financials are based on the most recent Mortgage that was taken out on this home.
Original Mortgage
$101,099
Interest Rate
7.8%
Create a Home Valuation Report for This Property
The Home Valuation Report is an in-depth analysis detailing your home's value as well as a comparison with similar homes in the area
Home Values in the Area
Average Home Value in this Area
Purchase History
| Date | Buyer | Sale Price | Title Company |
|---|---|---|---|
| Hurd Margaret M | -- | -- | |
| Hurd Margaret M | -- | -- | |
| Johnston Keri E | $143,000 | -- | |
| Deutsche Bank National Trust C | -- | -- | |
| -- | -- | -- | |
| -- | -- | -- | |
| Patrick Frederick D | $120,600 | -- |
Source: Public Records
Mortgage History
| Date | Status | Borrower | Loan Amount |
|---|---|---|---|
| Open | Johnston Keri E | $114,400 | |
| Closed | Hurd Margaret M | $114,400 | |
| Previous Owner | Patrick Frederick D | $101,099 |
Source: Public Records
Tax History Compared to Growth
Tax History
| Year | Tax Paid | Tax Assessment Tax Assessment Total Assessment is a certain percentage of the fair market value that is determined by local assessors to be the total taxable value of land and additions on the property. | Land | Improvement |
|---|---|---|---|---|
| 2024 | $3,365 | $138,532 | $12,000 | $126,532 |
| 2023 | $3,327 | $130,160 | $12,000 | $118,160 |
| 2022 | $2,612 | $102,064 | $12,000 | $90,064 |
| 2021 | $2,413 | $84,892 | $10,000 | $74,892 |
| 2020 | $2,170 | $74,912 | $10,000 | $64,912 |
| 2019 | $2,133 | $72,652 | $10,000 | $62,652 |
| 2018 | $1,919 | $65,572 | $8,800 | $56,772 |
| 2017 | $1,690 | $57,360 | $8,800 | $48,560 |
| 2016 | $499 | $47,944 | $8,800 | $39,144 |
| 2015 | $528 | $48,556 | $8,800 | $39,756 |
| 2014 | $385 | $34,612 | $8,800 | $25,812 |
| 2013 | -- | $28,440 | $8,800 | $19,640 |
Source: Public Records
Map
Nearby Homes
- 190 Crestworth Ct
- 81 Sheffield Ln
- 177 Grandview Ln
- 67 Haley Ct
- 253 Pine Valley Dr
- 259 Pine Valley Dr
- 62 Yosemite Ln
- 18 Thorntree Pass
- 484 Legacy Park Dr
- 1 Thorntree Pass
- 407 Yellowstone Dr
- 5843 Millers Pond Ln
- 80 Brownsville Extension
- 5036 Hiram Douglasville Hwy
- 820 Bennett Rd
- 2794 Cleburne Pkwy
- 5780 Hill Rd
- 159 Crestworth Place
- 160 Crestworth Place Unit 4
- 147 Crestworth Place
- 146 Crestworth Place
- 121 Crestworth Place
- 120 Crestworth Place
- 0 Crestworth Place Unit 8456992
- 0 Crestworth Place Unit 3154074
- 0 Crestworth Place Unit 8350811
- 0 Crestworth Place Unit 7281356
- 0 Crestworth Place Unit 3104473
- 0 Crestworth Place Unit 3195118
- 0 Crestworth Place Unit 8015369
- 219 Crestworth Ct
- 93 Crestworth Place
- 229 Crestworth Ct
- 205 Crestworth Ct
- 71 Crestworth Place
- 90 Crestworth Place Unit 4
- 193 Crestworth Ct