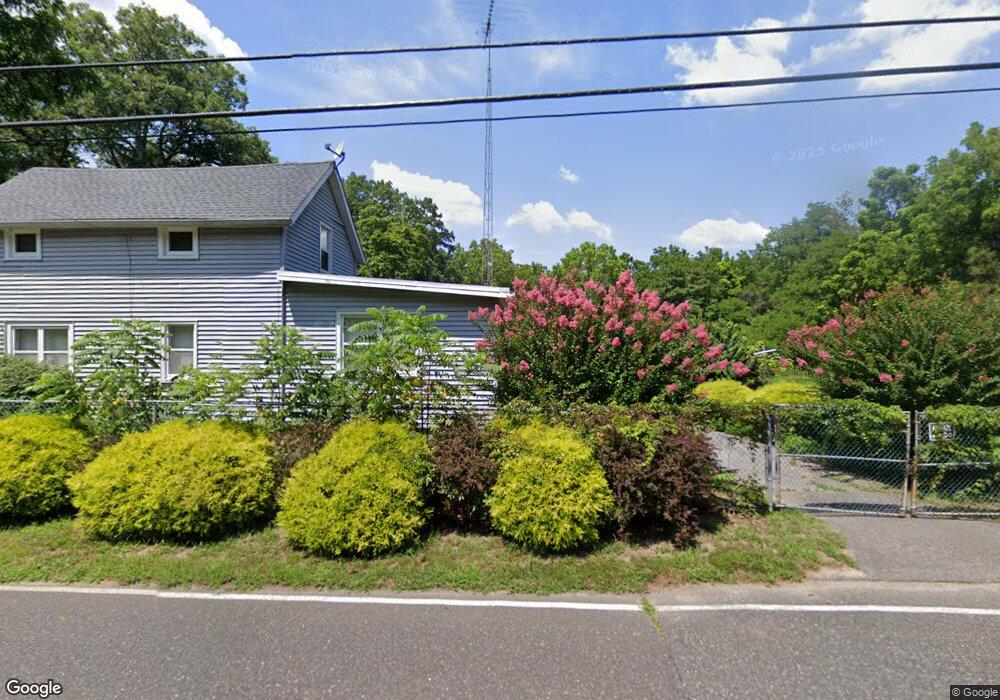
162 Cumberland Ave Estell Manor, NJ 08319
Estimated Value: $192,000 - $404,000
--
Bed
--
Bath
1,433
Sq Ft
$226/Sq Ft
Est. Value
About This Home
This home is located at 162 Cumberland Ave, Estell Manor, NJ 08319 and is currently estimated at $323,775, approximately $225 per square foot. 162 Cumberland Ave is a home located in Atlantic County with nearby schools including Estell Manor Elementary School.
Ownership History
Date
Name
Owned For
Owner Type
Purchase Details
Closed on
Feb 25, 2005
Sold by
Spinelli Priscilla M and Moeller Priscilla M
Bought by
Spinelli Priscilla M
Current Estimated Value
Home Financials for this Owner
Home Financials are based on the most recent Mortgage that was taken out on this home.
Original Mortgage
$153,000
Outstanding Balance
$76,382
Interest Rate
5.38%
Mortgage Type
New Conventional
Estimated Equity
$247,393
Purchase Details
Closed on
Sep 29, 2000
Sold by
Pasetchnik Arturo and Pasetchnik Tamara
Bought by
Moeller Priscilla M
Home Financials for this Owner
Home Financials are based on the most recent Mortgage that was taken out on this home.
Original Mortgage
$70,000
Interest Rate
7.89%
Purchase Details
Closed on
Oct 14, 1999
Sold by
Riesenburger Franklin J
Bought by
Pasetchnik Arturo and Pasetchnik Tamara
Create a Home Valuation Report for This Property
The Home Valuation Report is an in-depth analysis detailing your home's value as well as a comparison with similar homes in the area
Home Values in the Area
Average Home Value in this Area
Purchase History
| Date | Buyer | Sale Price | Title Company |
|---|---|---|---|
| Spinelli Priscilla M | -- | -- | |
| Moeller Priscilla M | $80,000 | Fidelity National Title Ins | |
| Pasetchnik Arturo | $53,000 | -- |
Source: Public Records
Mortgage History
| Date | Status | Borrower | Loan Amount |
|---|---|---|---|
| Open | Spinelli Priscilla M | $153,000 | |
| Closed | Moeller Priscilla M | $70,000 |
Source: Public Records
Tax History Compared to Growth
Tax History
| Year | Tax Paid | Tax Assessment Tax Assessment Total Assessment is a certain percentage of the fair market value that is determined by local assessors to be the total taxable value of land and additions on the property. | Land | Improvement |
|---|---|---|---|---|
| 2025 | $4,833 | $166,900 | $59,000 | $107,900 |
| 2024 | $4,833 | $166,900 | $59,000 | $107,900 |
| 2023 | $4,580 | $166,900 | $59,000 | $107,900 |
| 2022 | $4,580 | $166,900 | $59,000 | $107,900 |
| 2021 | $4,435 | $166,900 | $59,000 | $107,900 |
| 2020 | $4,316 | $166,900 | $59,000 | $107,900 |
| 2019 | $4,249 | $166,900 | $59,000 | $107,900 |
| 2018 | $4,041 | $166,900 | $59,000 | $107,900 |
| 2017 | $4,032 | $166,900 | $59,000 | $107,900 |
| 2016 | $3,997 | $166,900 | $59,000 | $107,900 |
| 2015 | $3,947 | $166,900 | $59,000 | $107,900 |
| 2014 | $3,829 | $166,900 | $59,000 | $107,900 |
Source: Public Records
Map
Nearby Homes
- 180 5th Ave
- 165 6th Ave
- 147 Cumberland Ave
- 165 4th Ave
- 151 9th Ave
- 135 9th Ave
- 1420 10th Ave
- 159 3rd Ave
- 1418-1420 10th Ave
- 1101 11th Ave
- 103 Cumberland Ave
- 182 1st Ave
- 603 16th St
- 0 4th Ave Unit 586695
- 31 S Jersey Ave
- 38 Cape May Ave
- 13 & 15 Estell Ave
- 15, 17, & 19 Cape May Ave
- 229 Honest John Rd
- 13 S Jersey Ave
- 160 Cumberland Ave
- 164 Cumberland Ave
- 158 Cumberland Ave
- 166 Cumberland Ave
- 179 7th Ave E
- 156 Cumberland Ave
- 167 Cumberland Ave
- 165 Cumberland Ave
- 169 Cumberland Ave
- 170 Cumberland Ave
- 171 Cumberland Ave
- 183 7th Ave E
- 162 7th Ave E
- 164 7th Ave E
- 154 Cumberland Ave
- 175 7th Ave E
- 168 Cumberland Ave
- 173 Cumberland Ave
- 175 Cumberland Ave