162 High St Carver, MA 02330
Estimated Value: $641,000 - $722,000
3
Beds
2
Baths
2,210
Sq Ft
$314/Sq Ft
Est. Value
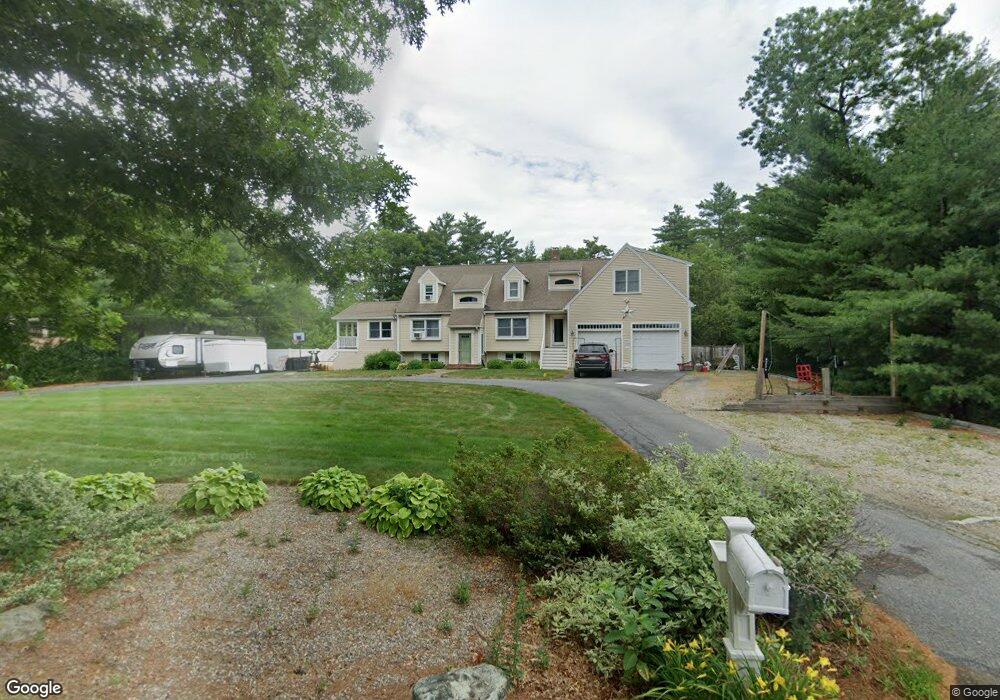
About This Home
This home is located at 162 High St, Carver, MA 02330 and is currently estimated at $693,369, approximately $313 per square foot. 162 High St is a home located in Plymouth County with nearby schools including Carver Elementary School, Map Academy Charter School, and Sacred Heart High School.
Ownership History
Date
Name
Owned For
Owner Type
Purchase Details
Closed on
Sep 26, 2018
Sold by
Buffington Stephen M and Buffington Janet M
Bought by
Moore Angela L
Current Estimated Value
Home Financials for this Owner
Home Financials are based on the most recent Mortgage that was taken out on this home.
Original Mortgage
$277,000
Outstanding Balance
$241,560
Interest Rate
4.5%
Mortgage Type
New Conventional
Estimated Equity
$451,809
Create a Home Valuation Report for This Property
The Home Valuation Report is an in-depth analysis detailing your home's value as well as a comparison with similar homes in the area
Home Values in the Area
Average Home Value in this Area
Purchase History
| Date | Buyer | Sale Price | Title Company |
|---|---|---|---|
| Moore Angela L | $400,000 | -- |
Source: Public Records
Mortgage History
| Date | Status | Borrower | Loan Amount |
|---|---|---|---|
| Open | Moore Angela L | $277,000 |
Source: Public Records
Tax History Compared to Growth
Tax History
| Year | Tax Paid | Tax Assessment Tax Assessment Total Assessment is a certain percentage of the fair market value that is determined by local assessors to be the total taxable value of land and additions on the property. | Land | Improvement |
|---|---|---|---|---|
| 2025 | $8,584 | $618,900 | $143,200 | $475,700 |
| 2024 | $8,041 | $567,500 | $140,400 | $427,100 |
| 2023 | $7,771 | $532,600 | $140,400 | $392,200 |
| 2022 | $7,322 | $458,200 | $120,000 | $338,200 |
| 2021 | $7,040 | $415,600 | $107,200 | $308,400 |
| 2020 | $6,702 | $389,900 | $100,200 | $289,700 |
| 2019 | $6,525 | $382,700 | $97,200 | $285,500 |
| 2018 | $6,051 | $343,200 | $97,200 | $246,000 |
| 2017 | $5,834 | $329,800 | $93,600 | $236,200 |
| 2016 | $5,366 | $315,100 | $89,100 | $226,000 |
| 2015 | $5,072 | $298,200 | $89,100 | $209,100 |
| 2014 | $4,889 | $287,400 | $112,600 | $174,800 |
Source: Public Records
Map
Nearby Homes
- 0 Spring St
- 122 High St
- 20 Spring St
- 6 Kestrel Way
- 6 Twin Pines Ln Unit 6
- 6 Susan Cir
- 64 Wenham Rd
- 14 Cushman Landing
- 14 Amy Ln
- 48 Columbia Cir
- 25 Dukes Brook Rd
- 3 Alec Ln
- 34 Surrey Dr
- 135 Plymouth St
- 200 Plympton Rd
- 51 Mariner's Way Unit 51
- 2 Mariner's Way Unit 306
- 11 Brockton Ave
- 19 Coachman Terrace
- 37 Flintlocke Dr