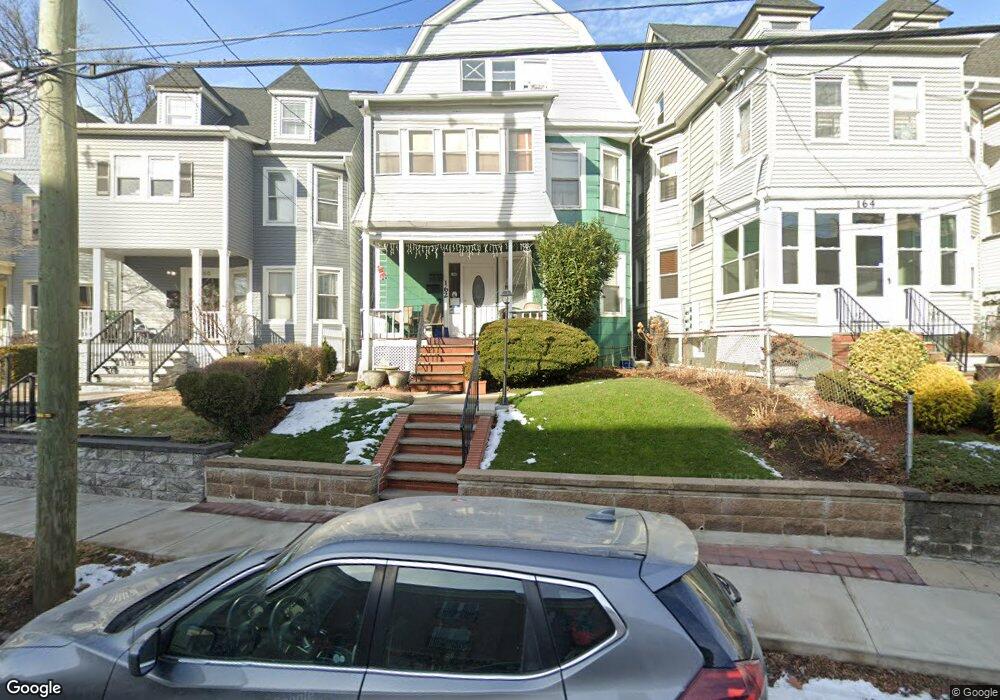
162 Main St West Orange, NJ 07052
Estimated Value: $478,000 - $578,000
--
Bed
--
Bath
1,832
Sq Ft
$284/Sq Ft
Est. Value
About This Home
This home is located at 162 Main St, West Orange, NJ 07052 and is currently estimated at $520,466, approximately $284 per square foot. 162 Main St is a home located in Essex County with nearby schools including West Orange High School, East Orange Community Charter School, and Mount Carmel Guild Academy.
Ownership History
Date
Name
Owned For
Owner Type
Purchase Details
Closed on
Jan 27, 2009
Sold by
Goizueta Rosa
Bought by
Salas Petter
Current Estimated Value
Purchase Details
Closed on
Feb 9, 2005
Sold by
Caamano Antonio
Bought by
Cortes Rosa Goizueta and Salas Peter
Home Financials for this Owner
Home Financials are based on the most recent Mortgage that was taken out on this home.
Original Mortgage
$263,220
Interest Rate
5.66%
Mortgage Type
FHA
Create a Home Valuation Report for This Property
The Home Valuation Report is an in-depth analysis detailing your home's value as well as a comparison with similar homes in the area
Home Values in the Area
Average Home Value in this Area
Purchase History
| Date | Buyer | Sale Price | Title Company |
|---|---|---|---|
| Salas Petter | -- | None Available | |
| Cortes Rosa Goizueta | $185,000 | -- |
Source: Public Records
Mortgage History
| Date | Status | Borrower | Loan Amount |
|---|---|---|---|
| Previous Owner | Cortes Rosa Goizueta | $263,220 |
Source: Public Records
Tax History Compared to Growth
Tax History
| Year | Tax Paid | Tax Assessment Tax Assessment Total Assessment is a certain percentage of the fair market value that is determined by local assessors to be the total taxable value of land and additions on the property. | Land | Improvement |
|---|---|---|---|---|
| 2025 | $9,371 | $548,400 | $210,000 | $338,400 |
| 2024 | $9,371 | $203,800 | $56,100 | $147,700 |
| 2022 | $9,043 | $203,800 | $56,100 | $147,700 |
| 2021 | $8,873 | $203,800 | $56,100 | $147,700 |
| 2020 | $8,731 | $203,800 | $56,100 | $147,700 |
| 2019 | $8,480 | $203,800 | $56,100 | $147,700 |
| 2018 | $8,229 | $203,800 | $56,100 | $147,700 |
| 2017 | $8,123 | $203,800 | $56,100 | $147,700 |
| 2016 | $7,928 | $203,800 | $56,100 | $147,700 |
| 2015 | $7,779 | $203,800 | $56,100 | $147,700 |
| 2014 | $7,626 | $203,800 | $56,100 | $147,700 |
Source: Public Records
Map
Nearby Homes
- 29 Erwin Place
- 52 Columbia St
- 162 Summer St
- 6 Prospect Place
- 257 Mount Vernon Ave
- 48 Liberty St
- 28 Wildwood Ave
- 7 Sayres Place
- 7 Sayers Place
- 56 Llewellyn Ave
- 355 Bradford St
- 380 Berryman Place
- 50 Wildwood Ave
- 46 N Jefferson St
- 379 High St
- 36 William St
- 350 Main St
- 114 Mount Pleasant Ave
- 401 White St
- 81 High St Unit 8