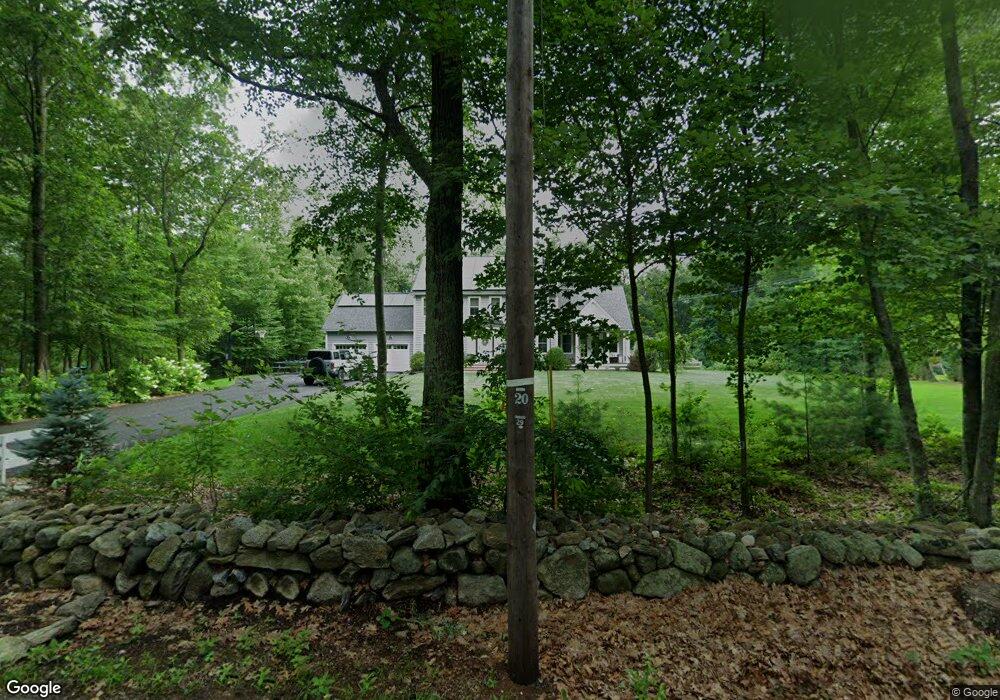
162 Maple St Douglas, MA 01516
Estimated Value: $698,000 - $832,000
4
Beds
3
Baths
2,300
Sq Ft
$329/Sq Ft
Est. Value
About This Home
This home is located at 162 Maple St, Douglas, MA 01516 and is currently estimated at $755,749, approximately $328 per square foot. 162 Maple St is a home located in Worcester County with nearby schools including Douglas Primary School, Douglas Middle School, and Douglas High School.
Ownership History
Date
Name
Owned For
Owner Type
Purchase Details
Closed on
Aug 15, 2014
Sold by
Oriole Rt and Heney Daniel J
Bought by
Heney Thomas J and Heney Marie A
Current Estimated Value
Home Financials for this Owner
Home Financials are based on the most recent Mortgage that was taken out on this home.
Original Mortgage
$394,250
Outstanding Balance
$300,390
Interest Rate
4.09%
Mortgage Type
New Conventional
Estimated Equity
$455,359
Create a Home Valuation Report for This Property
The Home Valuation Report is an in-depth analysis detailing your home's value as well as a comparison with similar homes in the area
Home Values in the Area
Average Home Value in this Area
Purchase History
| Date | Buyer | Sale Price | Title Company |
|---|---|---|---|
| Heney Thomas J | $435,000 | -- |
Source: Public Records
Mortgage History
| Date | Status | Borrower | Loan Amount |
|---|---|---|---|
| Open | Heney Thomas J | $394,250 |
Source: Public Records
Tax History Compared to Growth
Tax History
| Year | Tax Paid | Tax Assessment Tax Assessment Total Assessment is a certain percentage of the fair market value that is determined by local assessors to be the total taxable value of land and additions on the property. | Land | Improvement |
|---|---|---|---|---|
| 2025 | $87 | $661,500 | $99,100 | $562,400 |
| 2024 | $8,578 | $634,500 | $90,100 | $544,400 |
| 2023 | $8,319 | $579,300 | $90,100 | $489,200 |
| 2022 | $8,714 | $533,300 | $83,300 | $450,000 |
| 2021 | $8,592 | $513,900 | $79,300 | $434,600 |
| 2020 | $8,352 | $491,900 | $79,300 | $412,600 |
| 2019 | $8,444 | $482,500 | $79,300 | $403,200 |
| 2018 | $7,510 | $467,300 | $79,300 | $388,000 |
| 2017 | $8,265 | $494,300 | $82,500 | $411,800 |
| 2016 | $7,984 | $474,700 | $82,500 | $392,200 |
| 2015 | $1,358 | $82,500 | $82,500 | $0 |
Source: Public Records
Map
Nearby Homes
- 153 Davis St
- 296 Yew St
- 99 Maple St
- 405 West St
- 103 Uxbridge St
- 10 Eagle Dr
- 183 S East Main St
- 189 Main St
- 56 Yew St
- 279 S East Main St Unit Lot 2
- 134 Mantell Rd
- 138 Mantell Rd
- 145 Mantell Rd
- 169 Mantell Rd
- 137 Mantell Rd
- 2 C St
- 295 S East Main St Unit Lot 6
- 104 Eber Taft Rd
- 33 Summerfield Dr Unit 33
- 299 S East Main St Unit Lot 7