Estimated Value: $227,000 - $275,000
3
Beds
2
Baths
1,156
Sq Ft
$217/Sq Ft
Est. Value
About This Home
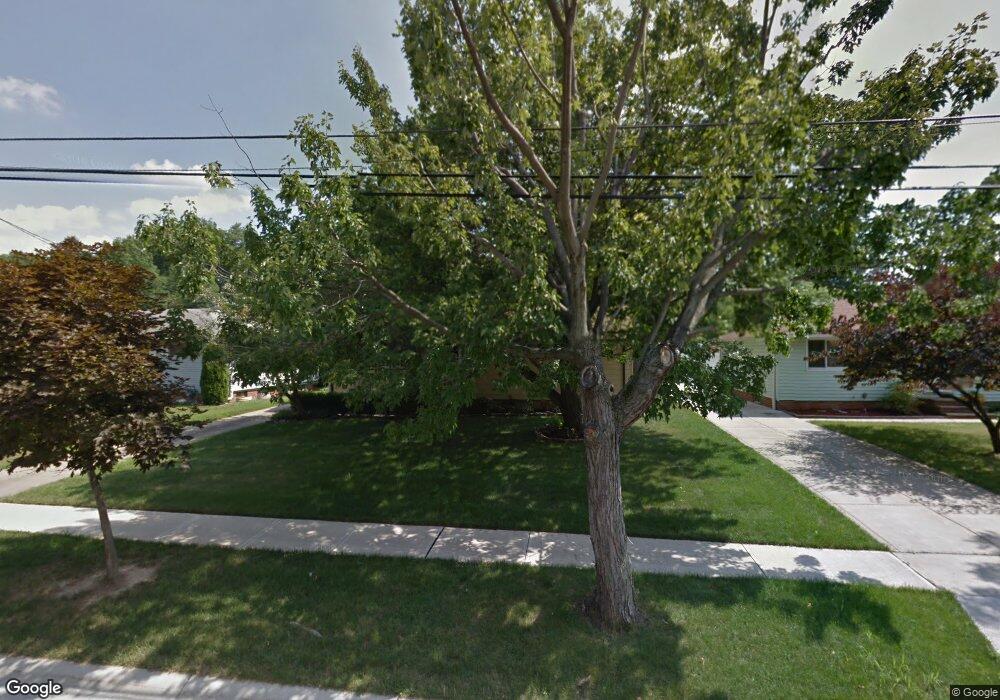
This home is located at 162 Maplelawn Dr, Berea, OH 44017 and is currently estimated at $250,939, approximately $217 per square foot. 162 Maplelawn Dr is a home located in Cuyahoga County with nearby schools including Grindstone Elementary School, Berea-Midpark Middle School, and Berea-Midpark High School.
Ownership History
Date
Name
Owned For
Owner Type
Purchase Details
Closed on
Jul 22, 2005
Sold by
Huber Michael R and Huber Karen M
Bought by
Brockwich Mark A
Current Estimated Value
Home Financials for this Owner
Home Financials are based on the most recent Mortgage that was taken out on this home.
Original Mortgage
$126,000
Interest Rate
6%
Mortgage Type
Purchase Money Mortgage
Purchase Details
Closed on
Sep 5, 1997
Sold by
Gray David A
Bought by
Huber Michael R and Huber Karen M
Home Financials for this Owner
Home Financials are based on the most recent Mortgage that was taken out on this home.
Original Mortgage
$105,470
Interest Rate
7.54%
Mortgage Type
FHA
Purchase Details
Closed on
Jan 14, 1988
Sold by
Martin Courtney D and Martin Beverly
Bought by
Gray David A
Purchase Details
Closed on
Jan 1, 1975
Bought by
Martin Courtney D and Martin Beverly
Create a Home Valuation Report for This Property
The Home Valuation Report is an in-depth analysis detailing your home's value as well as a comparison with similar homes in the area
Home Values in the Area
Average Home Value in this Area
Purchase History
| Date | Buyer | Sale Price | Title Company |
|---|---|---|---|
| Brockwich Mark A | $135,000 | Midland Title Agency | |
| Huber Michael R | $106,000 | -- | |
| Gray David A | $68,000 | -- | |
| Martin Courtney D | -- | -- |
Source: Public Records
Mortgage History
| Date | Status | Borrower | Loan Amount |
|---|---|---|---|
| Previous Owner | Brockwich Mark A | $126,000 | |
| Previous Owner | Huber Michael R | $105,470 |
Source: Public Records
Tax History Compared to Growth
Tax History
| Year | Tax Paid | Tax Assessment Tax Assessment Total Assessment is a certain percentage of the fair market value that is determined by local assessors to be the total taxable value of land and additions on the property. | Land | Improvement |
|---|---|---|---|---|
| 2024 | $3,768 | $65,030 | $13,020 | $52,010 |
| 2023 | $3,638 | $52,680 | $12,920 | $39,760 |
| 2022 | $3,615 | $52,680 | $12,920 | $39,760 |
| 2021 | $3,585 | $52,680 | $12,920 | $39,760 |
| 2020 | $4,022 | $44,660 | $10,960 | $33,710 |
| 2019 | $4,627 | $127,600 | $31,300 | $96,300 |
| 2018 | $3,679 | $44,660 | $10,960 | $33,710 |
| 2017 | $3,272 | $40,890 | $8,930 | $31,960 |
| 2016 | $3,247 | $40,890 | $8,930 | $31,960 |
| 2015 | $3,229 | $40,890 | $8,930 | $31,960 |
| 2014 | $3,229 | $43,020 | $9,380 | $33,640 |
Source: Public Records
Map
Nearby Homes
- 9401 Pheasant Run Place
- 8627 Courtland Dr
- 84 Sprague Rd
- 104 Whitehall Dr
- 8036 Fair Rd
- 20424 Scotch Pine Way
- 740 Fair St
- 148 Meadow Cir
- 243 Jananna Dr
- 8902 Lincolnshire Blvd
- 21176 Hickory Branch Trail
- 19890 Idlewood Trail
- 10353 Oak Branch Trail
- 10839 Prospect Rd
- 74 Aaron St
- 20684 Albion Rd
- 23 Hamilton St
- 9829 Plum Brook Ln
- 20050 Idlewood Trail
- 18737 Evergreen Dr
- 168 Maplelawn Dr
- 150 Maplelawn Dr
- 174 Maplelawn Dr
- 161 Maplelawn Dr
- 180 Maplelawn Dr
- 144 Maplelawn Dr
- 155 Maplelawn Dr
- 167 Maplelawn Dr
- 149 Maplelawn Dr
- 173 Maplelawn Dr
- 138 Maplelawn Dr
- 186 Maplelawn Dr
- 139 Maplelawn Dr
- 183 Maplelawn Dr
- 194 Maplelawn Dr
- 128 Maplelawn Dr
- 162 Milton St
- 131 Maplelawn Dr
- 156 Milton St
- 168 Milton St