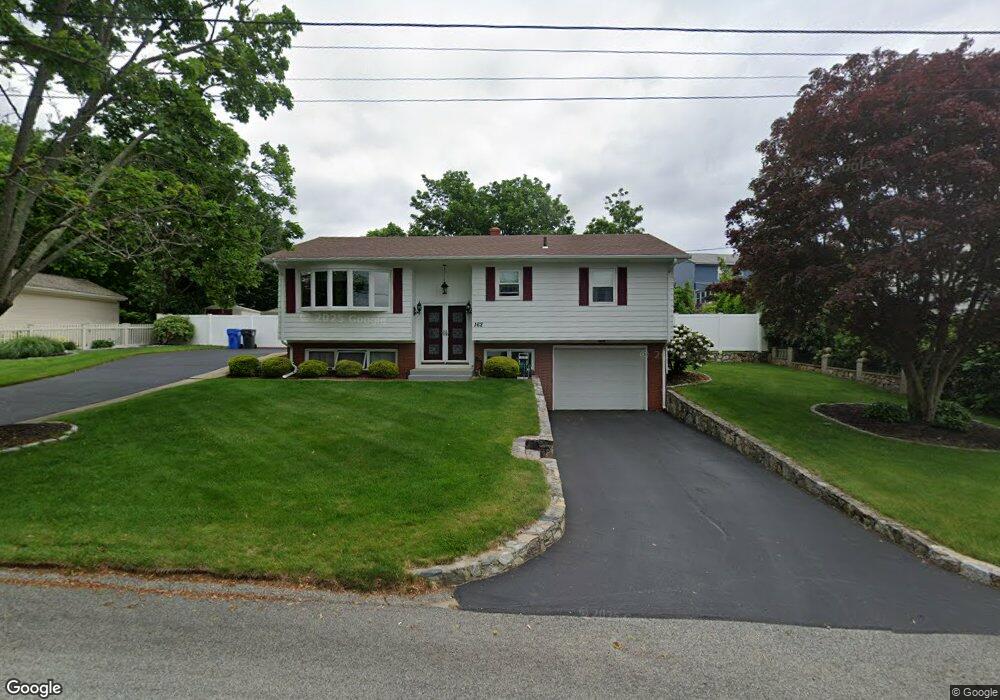
162 Marlow St Cranston, RI 02920
Thornton NeighborhoodEstimated Value: $432,000 - $658,000
2
Beds
2
Baths
1,164
Sq Ft
$437/Sq Ft
Est. Value
About This Home
This home is located at 162 Marlow St, Cranston, RI 02920 and is currently estimated at $508,635, approximately $436 per square foot. 162 Marlow St is a home located in Providence County with nearby schools including Stone Hill School, Western Hills Middle School, and Cranston High School West.
Ownership History
Date
Name
Owned For
Owner Type
Purchase Details
Closed on
Mar 10, 1993
Sold by
Aidjian Guido and Aidjian Mary
Bought by
Macari Paul J
Current Estimated Value
Create a Home Valuation Report for This Property
The Home Valuation Report is an in-depth analysis detailing your home's value as well as a comparison with similar homes in the area
Home Values in the Area
Average Home Value in this Area
Purchase History
We collect this data history from publicly available records. To have your information removed, we recommend requesting removal directly through your county’s website.
| Date | Buyer | Sale Price | Title Company |
|---|---|---|---|
| Macari Paul J | $127,500 | -- |
Source: Public Records
Mortgage History
We collect this data history from publicly available records. To have your information removed, we recommend requesting removal directly through your county’s website.
| Date | Status | Borrower | Loan Amount |
|---|---|---|---|
| Open | Macari Paul J | $98,000 | |
| Closed | Macari Paul J | $105,000 | |
| Closed | Macari Paul J | $113,000 | |
| Closed | Macari Paul J | $103,500 |
Source: Public Records
Tax History
| Year | Tax Paid | Tax Assessment Tax Assessment Total Assessment is a certain percentage of the fair market value that is determined by local assessors to be the total taxable value of land and additions on the property. | Land | Improvement |
|---|---|---|---|---|
| 2025 | $5,991 | $431,600 | $134,000 | $297,600 |
| 2024 | $5,874 | $431,600 | $134,000 | $297,600 |
| 2023 | $5,428 | $287,200 | $96,300 | $190,900 |
| 2022 | $5,316 | $287,200 | $96,300 | $190,900 |
| 2021 | $5,170 | $287,200 | $96,300 | $190,900 |
| 2020 | $5,375 | $258,800 | $96,300 | $162,500 |
| 2019 | $5,375 | $258,800 | $96,300 | $162,500 |
| 2018 | $5,251 | $258,800 | $96,300 | $162,500 |
| 2017 | $4,856 | $211,700 | $77,000 | $134,700 |
| 2016 | $4,753 | $211,700 | $77,000 | $134,700 |
| 2015 | $4,753 | $211,700 | $77,000 | $134,700 |
| 2014 | $4,438 | $194,300 | $77,000 | $117,300 |
Source: Public Records
Map
Nearby Homes
- 131 Woodland Ave
- 0 Macera Dr
- 38 Woodland Ave
- 46 Lake Garden Dr
- 31 Yeoman Ave
- 65 Traymore St
- 77 Rockwood Ave
- 123 Royal Ave
- 290 Stony Acre Dr
- 60 Imperial Ave
- 1448 Plainfield Pike
- 89 Royal Ave
- 114 Birchwood Dr
- 5 Mill St
- 64 Westfield Dr
- 44 Valente Dr
- 0 Clemence St
- 0 Plainfield Pike Unit 1411477
- 83 Valente Dr
- 3 Garden Vista Dr Unit 3
Your Personal Tour Guide
Ask me questions while you tour the home.