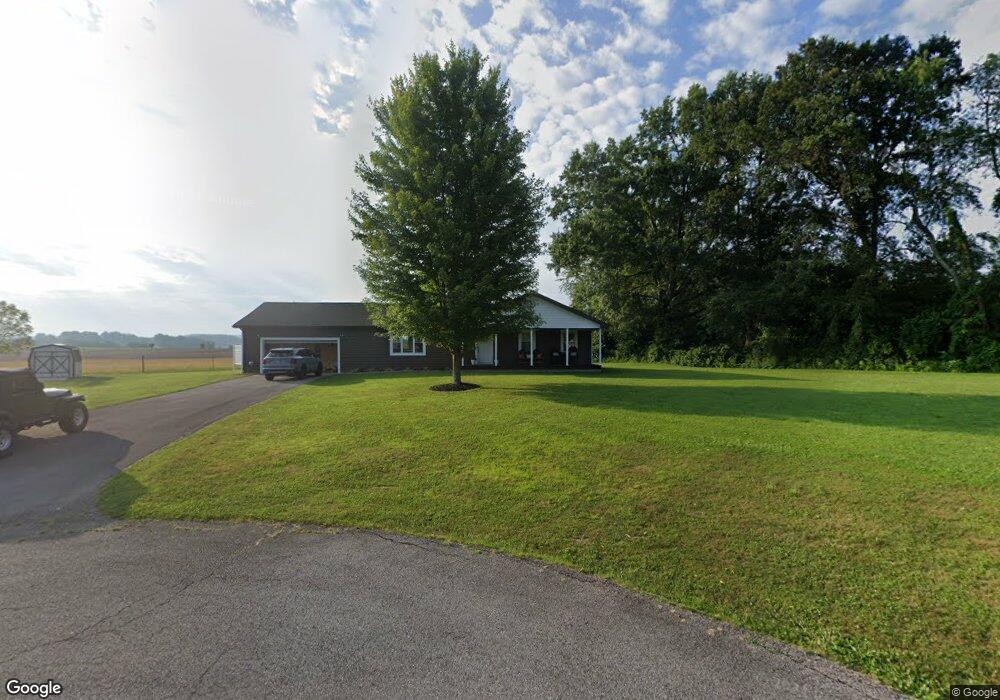
162 Nicholas Dr Peebles, OH 45660
Estimated Value: $235,721 - $351,000
3
Beds
2
Baths
1,630
Sq Ft
$174/Sq Ft
Est. Value
About This Home
This home is located at 162 Nicholas Dr, Peebles, OH 45660 and is currently estimated at $283,180, approximately $173 per square foot. 162 Nicholas Dr is a home located in Adams County with nearby schools including Peebles Elementary School and Peebles High School.
Ownership History
Date
Name
Owned For
Owner Type
Purchase Details
Closed on
Aug 19, 2016
Sold by
Sturgill Loyd M and Sturgill Tracie L
Bought by
Sturgill Loyd M and Sturgill Tracie L
Current Estimated Value
Home Financials for this Owner
Home Financials are based on the most recent Mortgage that was taken out on this home.
Original Mortgage
$116,000
Outstanding Balance
$50,298
Interest Rate
3.45%
Mortgage Type
New Conventional
Estimated Equity
$232,882
Purchase Details
Closed on
Oct 6, 2006
Sold by
Johnson Mark R and Johnson Melody
Bought by
Sturgill Tracie L and Sturgill Loyd M
Home Financials for this Owner
Home Financials are based on the most recent Mortgage that was taken out on this home.
Original Mortgage
$112,000
Interest Rate
6.5%
Mortgage Type
Future Advance Clause Open End Mortgage
Purchase Details
Closed on
Nov 3, 2004
Bought by
Johnson Mark R
Create a Home Valuation Report for This Property
The Home Valuation Report is an in-depth analysis detailing your home's value as well as a comparison with similar homes in the area
Purchase History
We collect this data history from publicly available records. To have your information removed, we recommend requesting removal directly through your county’s website.
| Date | Buyer | Sale Price | Title Company |
|---|---|---|---|
| Sturgill Loyd M | -- | None Available | |
| Sturgill Tracie L | $112,000 | None Available | |
| Johnson Mark R | $22,000 | -- |
Source: Public Records
Mortgage History
We collect this data history from publicly available records. To have your information removed, we recommend requesting removal directly through your county’s website.
| Date | Status | Borrower | Loan Amount |
|---|---|---|---|
| Open | Sturgill Loyd M | $116,000 | |
| Closed | Sturgill Tracie L | $112,000 |
Source: Public Records
Tax History
| Year | Tax Paid | Tax Assessment Tax Assessment Total Assessment is a certain percentage of the fair market value that is determined by local assessors to be the total taxable value of land and additions on the property. | Land | Improvement |
|---|---|---|---|---|
| 2025 | $2,468 | $54,850 | $9,660 | $45,190 |
| 2024 | $1,234 | $54,850 | $9,660 | $45,190 |
| 2023 | $1,185 | $54,850 | $9,660 | $45,190 |
| 2022 | $2,357 | $48,370 | $8,400 | $39,970 |
| 2021 | $2,292 | $48,370 | $8,400 | $39,970 |
| 2020 | $2,388 | $48,370 | $8,400 | $39,970 |
| 2019 | $2,388 | $48,370 | $8,400 | $39,970 |
| 2018 | $2,150 | $43,160 | $8,400 | $34,760 |
| 2017 | $2,124 | $43,160 | $8,400 | $34,760 |
| 2016 | $2,121 | $43,160 | $8,400 | $34,760 |
| 2015 | $2,031 | $42,460 | $3,960 | $38,500 |
| 2014 | $1,988 | $42,460 | $3,960 | $38,500 |
Source: Public Records
Map
Nearby Homes
- 161 Nicholas Dr
- 144 Nicholas Dr
- 124 Nicholas Dr
- 103 Nicholas Dr
- 0 Nicholas Dr Unit 1699946
- 68 Nicholas Dr
- 63 Nicholas Dr
- 56 Nicholas Dr
- 17 Nicholas Dr
- 15 Nicholas Dr
- 6049 Steam Furnace Rd
- 11 Nicholas Dr
- 12 Nicholas Dr
- 1 Nicholas Dr
- 2 Nicholas Dr
- 6140 Steam Furnace Rd
- 6190 Steam Furnace Rd
- 5986 Steam Furnace Rd
- 90 9th Ave
- 10 9th Ave
Your Personal Tour Guide
Ask me questions while you tour the home.