162 Seneca Dr Montpelier, OH 43543
Estimated Value: $520,000 - $660,790
5
Beds
4
Baths
2,472
Sq Ft
$237/Sq Ft
Est. Value
About This Home
This home is located at 162 Seneca Dr, Montpelier, OH 43543 and is currently estimated at $584,948, approximately $236 per square foot. 162 Seneca Dr is a home located in Williams County with nearby schools including North Central Elementary School and North Central Junior/Senior High School.
Ownership History
Date
Name
Owned For
Owner Type
Purchase Details
Closed on
May 24, 2024
Sold by
Thelen Kurt C and Thelen Julie L
Bought by
Kurt C And Julie L Thelen Family Trust and Thelen
Current Estimated Value
Purchase Details
Closed on
Oct 11, 2023
Sold by
Orwig Peggy L and Orwig Joseph E
Bought by
Thelen Kurt C and Thelen Julie L
Purchase Details
Closed on
Oct 20, 2008
Sold by
Mossing Tessa
Bought by
Orwig Joseph E and Orwig Peggy L
Purchase Details
Closed on
Jan 17, 2002
Sold by
Mossing Steven T and Mossing Tessa
Bought by
Mossing Tessa Trustee
Purchase Details
Closed on
Sep 14, 2000
Sold by
Hahn Harry E And
Bought by
Mossing Steven T and Mossing Tessa
Purchase Details
Closed on
Jan 1, 1990
Bought by
Hahn Harry E And
Create a Home Valuation Report for This Property
The Home Valuation Report is an in-depth analysis detailing your home's value as well as a comparison with similar homes in the area
Home Values in the Area
Average Home Value in this Area
Purchase History
| Date | Buyer | Sale Price | Title Company |
|---|---|---|---|
| Kurt C And Julie L Thelen Family Trust | -- | None Listed On Document | |
| Kurt C And Julie L Thelen Family Trust | -- | None Listed On Document | |
| Thelen Kurt C | $125 | Peak Title | |
| Orwig Joseph E | $72,500 | None Available | |
| Mossing Tessa Trustee | -- | -- | |
| Mossing Steven T | $10,000 | -- | |
| Hahn Harry E And | $3,300 | -- |
Source: Public Records
Tax History Compared to Growth
Tax History
| Year | Tax Paid | Tax Assessment Tax Assessment Total Assessment is a certain percentage of the fair market value that is determined by local assessors to be the total taxable value of land and additions on the property. | Land | Improvement |
|---|---|---|---|---|
| 2024 | $3,571 | $179,030 | $16,660 | $162,370 |
| 2023 | $7,138 | $128,590 | $19,670 | $108,920 |
| 2022 | $5,307 | $128,590 | $19,670 | $108,920 |
| 2021 | $5,307 | $128,590 | $19,670 | $108,920 |
| 2020 | $4,639 | $108,960 | $16,660 | $92,300 |
| 2019 | $4,605 | $108,960 | $16,660 | $92,300 |
| 2018 | $2,298 | $108,960 | $16,660 | $92,300 |
| 2017 | $4,394 | $107,000 | $18,340 | $88,660 |
| 2016 | $4,172 | $107,000 | $18,340 | $88,660 |
| 2015 | $3,888 | $107,000 | $18,340 | $88,660 |
| 2014 | $3,888 | $95,900 | $16,660 | $79,240 |
| 2013 | $3,860 | $95,900 | $16,660 | $79,240 |
Source: Public Records
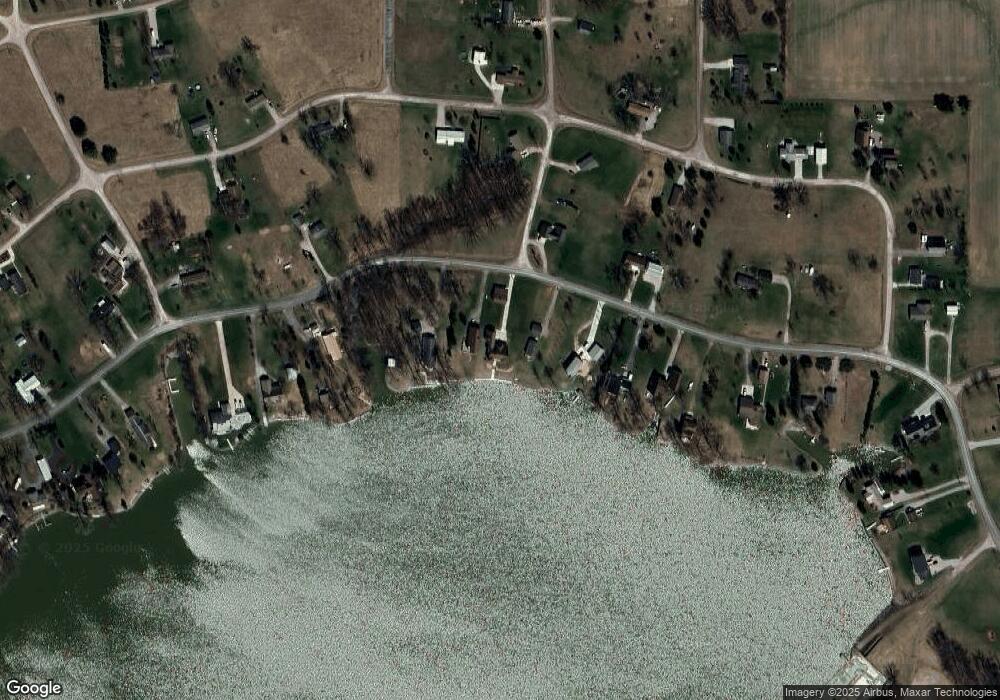
Map
Nearby Homes
- 155 Navajo Trail
- 111 Pontiac Trail
- 131 Choctaw Trail
- 0 Pontiac Trail Unit 10001711
- 145 Lumbee Ln
- 213 Navajo Trail
- 234 Seneca Dr
- 207 Modoc Trail
- 988-989 Seneca Dr
- 638 Seneca Dr
- 600 Seneca Dr
- 623-624 Yuma Trail
- 16993 County Road 12
- 14934 Heather Ct
- 14364 Horn Dr
- 16748 Us Highway 20ns
- 7208 County Road N-30
- 7208 County Road N30
- 301 S 3rd St
- 13551 Hillsdale Rd