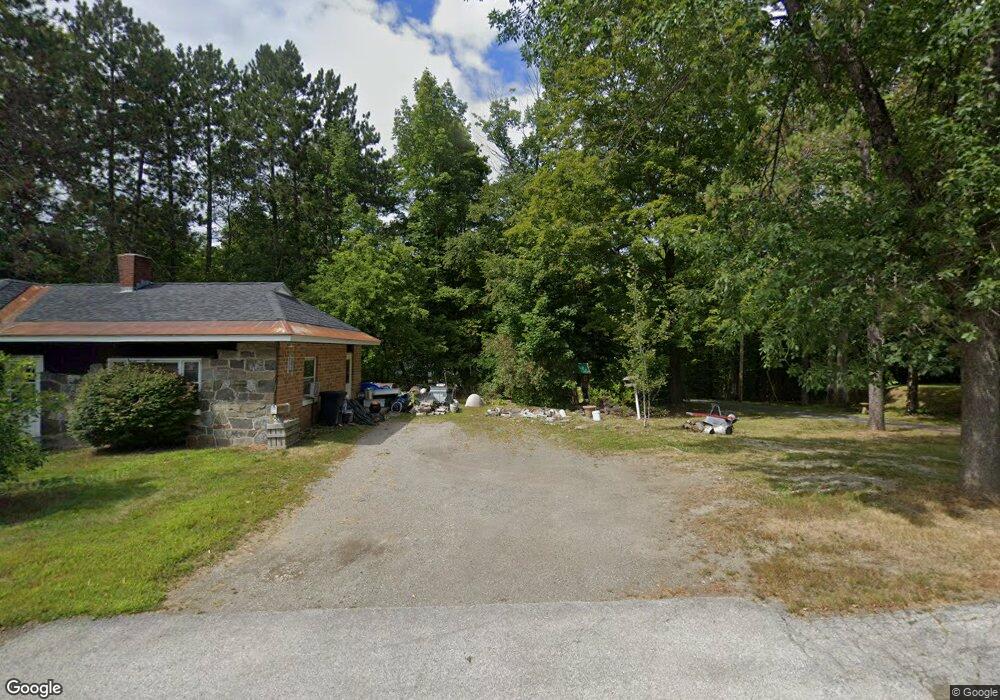
162 Summer St Dover Foxcroft, ME 04426
Estimated Value: $201,000 - $343,000
Studio
1
Bath
1,344
Sq Ft
$207/Sq Ft
Est. Value
About This Home
This home is located at 162 Summer St, Dover Foxcroft, ME 04426 and is currently estimated at $277,748, approximately $206 per square foot. 162 Summer St is a home located in Piscataquis County with nearby schools including Se Do Mo Cha Elementary School, Se Do Mo Cha Middle School, and Foxcroft Academy.
Ownership History
Date
Name
Owned For
Owner Type
Purchase Details
Closed on
Jun 10, 2024
Sold by
Rush Alan W
Bought by
Rush Alan W and Rush Jerry
Current Estimated Value
Purchase Details
Closed on
Jul 30, 2018
Sold by
Rush Alan W and Rush Ione R
Bought by
Rush Ione R and Rush Alan W
Purchase Details
Closed on
Aug 29, 2017
Sold by
Rush Alan and Rush Ione R
Bought by
Good-Leland Shary and Leland Howard A
Create a Home Valuation Report for This Property
The Home Valuation Report is an in-depth analysis detailing your home's value as well as a comparison with similar homes in the area
Home Values in the Area
Average Home Value in this Area
Purchase History
| Date | Buyer | Sale Price | Title Company |
|---|---|---|---|
| Rush Alan W | -- | None Available | |
| Rush Alan W | -- | None Available | |
| Rush Ione R | -- | -- | |
| Good-Leland Shary | -- | -- | |
| Rush Ione R | -- | -- | |
| Good-Leland Shary | -- | -- |
Source: Public Records
Tax History
| Year | Tax Paid | Tax Assessment Tax Assessment Total Assessment is a certain percentage of the fair market value that is determined by local assessors to be the total taxable value of land and additions on the property. | Land | Improvement |
|---|---|---|---|---|
| 2024 | $4,010 | $235,900 | $49,500 | $186,400 |
| 2023 | $3,625 | $195,400 | $45,700 | $149,700 |
| 2022 | $3,470 | $173,500 | $41,900 | $131,600 |
| 2021 | $3,550 | $165,100 | $38,000 | $127,100 |
| 2020 | $3,533 | $165,100 | $38,000 | $127,100 |
| 2019 | $3,550 | $165,100 | $38,000 | $127,100 |
| 2018 | $4,157 | $196,100 | $35,100 | $161,000 |
| 2017 | $4,473 | $214,000 | $53,000 | $161,000 |
| 2016 | $4,334 | $214,000 | $53,000 | $161,000 |
| 2015 | $3,980 | $214,000 | $53,000 | $161,000 |
| 2014 | $3,906 | $214,000 | $53,000 | $161,000 |
| 2013 | $3,777 | $214,000 | $53,000 | $161,000 |
Source: Public Records
Map
Nearby Homes
Your Personal Tour Guide
Ask me questions while you tour the home.