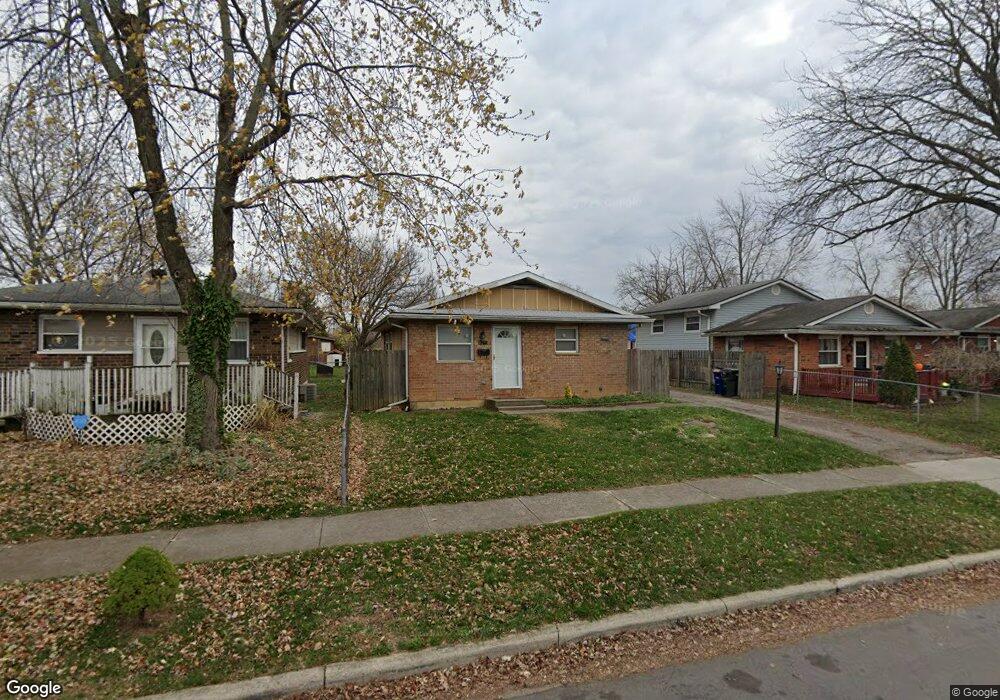
162 Tishman St Columbus, OH 43228
Estimated Value: $136,000 - $187,000
3
Beds
1
Bath
912
Sq Ft
$172/Sq Ft
Est. Value
About This Home
This home is located at 162 Tishman St, Columbus, OH 43228 and is currently estimated at $156,654, approximately $171 per square foot. 162 Tishman St is a home located in Franklin County with nearby schools including Eakin Elementary School, Wedgewood Middle School, and Briggs High School.
Ownership History
Date
Name
Owned For
Owner Type
Purchase Details
Closed on
Aug 12, 2010
Sold by
Us Bank National Association
Bought by
Sy Chandler H
Current Estimated Value
Purchase Details
Closed on
May 21, 2010
Sold by
Kelley Rickie and Case #07Cve 09 12181
Bought by
Us Bank National Association
Purchase Details
Closed on
Jan 30, 2004
Sold by
Reynolds Erskin and Reynolds Jacqueline
Bought by
Kelley Rickie
Home Financials for this Owner
Home Financials are based on the most recent Mortgage that was taken out on this home.
Original Mortgage
$59,200
Interest Rate
7.55%
Mortgage Type
Purchase Money Mortgage
Purchase Details
Closed on
Aug 23, 2000
Sold by
Allen Martiena and Allen Martiena V
Bought by
Reynolds Erskin
Purchase Details
Closed on
Sep 2, 1975
Bought by
Columbus Metropolitan
Create a Home Valuation Report for This Property
The Home Valuation Report is an in-depth analysis detailing your home's value as well as a comparison with similar homes in the area
Home Values in the Area
Average Home Value in this Area
Purchase History
| Date | Buyer | Sale Price | Title Company |
|---|---|---|---|
| Sy Chandler H | $24,900 | Rlm Title | |
| Us Bank National Association | $46,000 | None Available | |
| Kelley Rickie | $74,000 | Titlequest Agency Inc | |
| Reynolds Erskin | $5,000 | -- | |
| Allen Martinea V | -- | -- | |
| Columbus Metropolitan | -- | -- |
Source: Public Records
Mortgage History
| Date | Status | Borrower | Loan Amount |
|---|---|---|---|
| Previous Owner | Kelley Rickie | $59,200 |
Source: Public Records
Tax History Compared to Growth
Tax History
| Year | Tax Paid | Tax Assessment Tax Assessment Total Assessment is a certain percentage of the fair market value that is determined by local assessors to be the total taxable value of land and additions on the property. | Land | Improvement |
|---|---|---|---|---|
| 2024 | $2,045 | $44,630 | $8,750 | $35,880 |
| 2023 | $2,020 | $44,625 | $8,750 | $35,875 |
| 2022 | $1,155 | $21,740 | $8,050 | $13,690 |
| 2021 | $1,157 | $21,740 | $8,050 | $13,690 |
| 2020 | $1,159 | $21,740 | $8,050 | $13,690 |
| 2019 | $1,104 | $17,750 | $7,000 | $10,750 |
| 2018 | $551 | $17,750 | $7,000 | $10,750 |
| 2017 | $1,103 | $17,750 | $7,000 | $10,750 |
| 2016 | $1,068 | $15,720 | $4,590 | $11,130 |
| 2015 | $486 | $15,720 | $4,590 | $11,130 |
| 2014 | $975 | $15,720 | $4,590 | $11,130 |
| 2013 | $584 | $17,465 | $5,110 | $12,355 |
Source: Public Records
Map
Nearby Homes
- 147 Coolidge Ave
- 94 Florence Ave
- 3938 Halsey Place
- 139 Demorest Ave
- 4006 Halsey Place
- 638 Fairmoor Place
- 3831 Fairmoor Rd
- 644 Georgian Dr
- 195 S Sylvan Ave
- 4202 Atlanta Dr
- 743 Holly Hill Dr
- 776 Harwood Dr
- 38 Powhatan Ave
- 756 Brixham Rd
- 3300-3302 Sullivant Ave
- 4190 Salem Dr
- 3997 Briggs Rd
- 133 S Brinker Ave
- 3276-3278 Sullivant Ave
- 36-38 Orel Ave
- 156 Tishman St
- 170 Tishman St
- 176 Tishman St
- 163 Alice Rita St
- 157 Alice Rita St
- 171 Alice Rita St
- 144 Tishman St
- 184 Tishman St
- 177 Alice Rita St
- 149 Alice Rita St
- 163 Tishman St
- 169 Tishman St
- 157 Tishman St
- 185 Alice Rita St
- 143 Alice Rita St
- 175 Tishman St
- 136 Tishman St
- 149 Tishman St
- 190 Tishman St
- 181 Tishman St