Estimated Value: $575,901 - $592,000
4
Beds
3
Baths
2,238
Sq Ft
$261/Sq Ft
Est. Value
About This Home
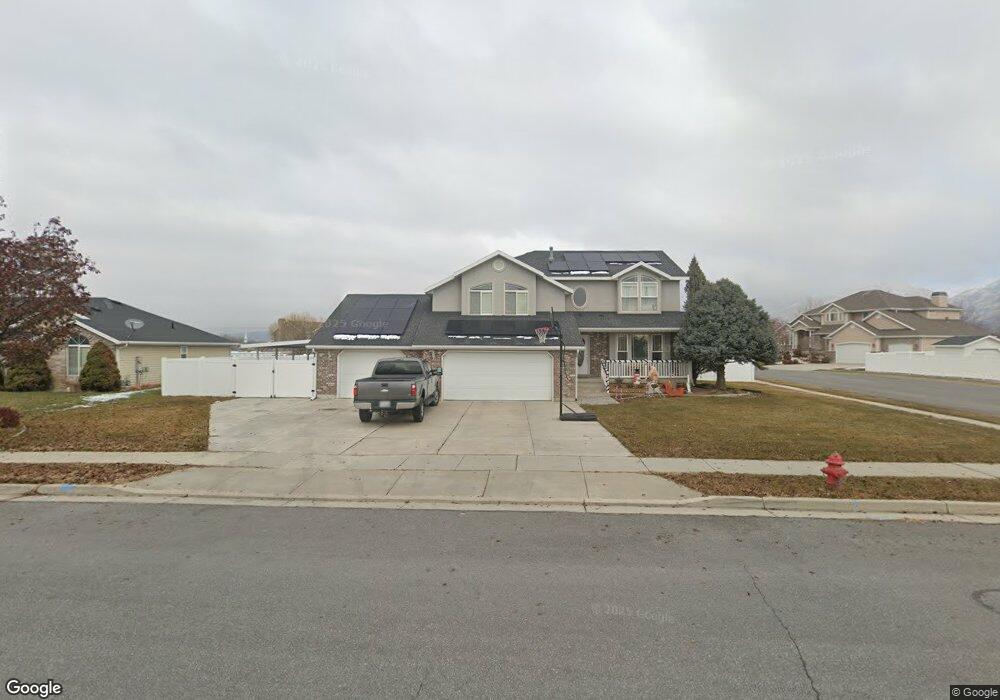
This home is located at 162 W 1250 N, Ogden, UT 84404 and is currently estimated at $583,225, approximately $260 per square foot. 162 W 1250 N is a home located in Weber County with nearby schools including Pioneer School, Orion Junior High School, and Weber High School.
Ownership History
Date
Name
Owned For
Owner Type
Purchase Details
Closed on
Mar 22, 2023
Sold by
Chaparro Ramon
Bought by
Ramon And Garimirka Chaparro Revocable Trust
Current Estimated Value
Purchase Details
Closed on
Jan 24, 2019
Sold by
Chaparro Ramon and Chaparro Garimirka
Bought by
Chaparro Ramon and Chaparro Garimirka
Purchase Details
Closed on
Sep 7, 2018
Bought by
Chaparro Ramon M
Home Financials for this Owner
Home Financials are based on the most recent Mortgage that was taken out on this home.
Original Mortgage
$262,400
Interest Rate
4.54%
Purchase Details
Closed on
Jan 28, 2000
Sold by
H M Fife & Sons Inc and Fife Boyd
Bought by
Peterson Samuel C and Peterson Christine M
Create a Home Valuation Report for This Property
The Home Valuation Report is an in-depth analysis detailing your home's value as well as a comparison with similar homes in the area
Home Values in the Area
Average Home Value in this Area
Purchase History
| Date | Buyer | Sale Price | Title Company |
|---|---|---|---|
| Ramon And Garimirka Chaparro Revocable Trust | -- | None Listed On Document | |
| Chaparro Ramon | -- | Old Republic Title | |
| Chaparro Ramon M | -- | -- | |
| Peterson Samuel C | -- | Cardon Land Title |
Source: Public Records
Mortgage History
| Date | Status | Borrower | Loan Amount |
|---|---|---|---|
| Previous Owner | Chaparro Ramon M | $262,400 | |
| Previous Owner | Chaparro Ramon M | -- |
Source: Public Records
Tax History Compared to Growth
Tax History
| Year | Tax Paid | Tax Assessment Tax Assessment Total Assessment is a certain percentage of the fair market value that is determined by local assessors to be the total taxable value of land and additions on the property. | Land | Improvement |
|---|---|---|---|---|
| 2025 | $3,623 | $527,368 | $143,296 | $384,072 |
| 2024 | $3,566 | $284,899 | $78,812 | $206,087 |
| 2023 | $3,452 | $278,850 | $78,813 | $200,037 |
| 2022 | $3,491 | $526,000 | $123,143 | $402,857 |
| 2021 | $2,565 | $384,000 | $77,757 | $306,243 |
| 2020 | $2,385 | $329,000 | $61,913 | $267,087 |
| 2019 | $2,384 | $312,000 | $51,847 | $260,153 |
| 2018 | $2,347 | $294,000 | $51,847 | $242,153 |
| 2017 | $2,133 | $250,000 | $51,847 | $198,153 |
| 2016 | $2,110 | $134,117 | $28,761 | $105,356 |
| 2015 | $1,916 | $119,668 | $25,987 | $93,681 |
| 2014 | $1,792 | $109,058 | $25,987 | $83,071 |
Source: Public Records
Map
Nearby Homes
- 1307 N 225 W
- 112 E 1475 N
- 1368 N 200 E
- 1196 N 375 W Unit 1
- Dearborn Plan at Ashlar Cove
- Harris Plan at Ashlar Cove
- 403 W 1225 N
- 403 W 1225 N Unit 7
- 2440 U S Highway 89
- 1271 N 350 E Unit 163
- 1246 N 325 E Unit 172
- Dalton Plan at Dixon Creek Townhomes
- 1264 N 325 E Unit 169
- Emery Plan at Dixon Creek Townhomes
- Oliver Plan at Dixon Creek Townhomes
- 2106 W 2000 N
- 315 E 1650 N Unit 129
- 327 E 1000 N
- 1450 N Washington Blvd Unit 51
- 1450 N Washington Blvd Unit 130