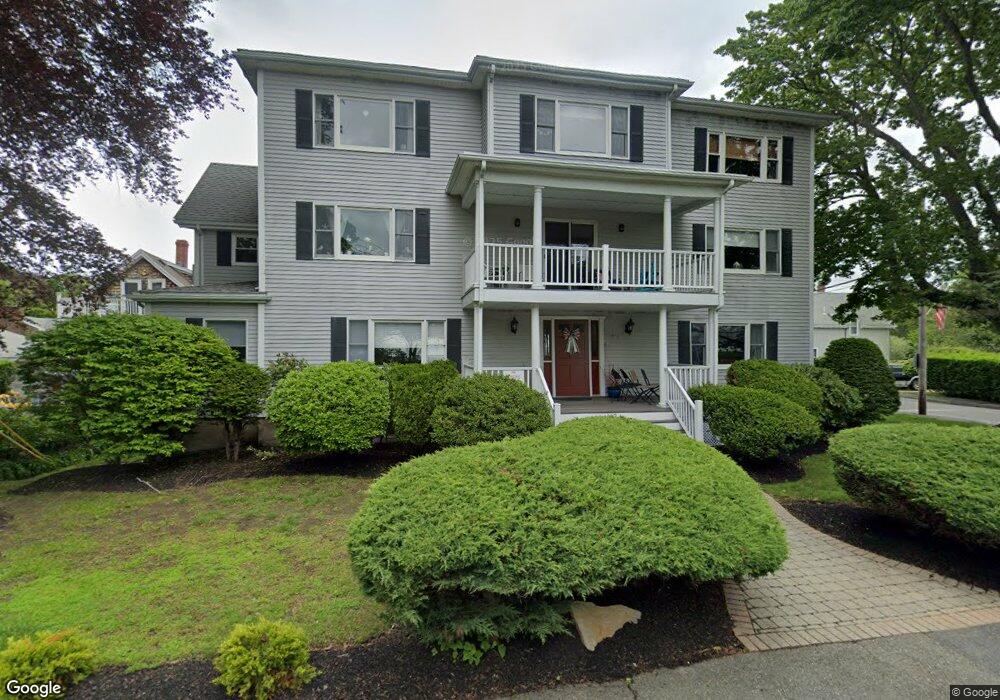
162 Willow Rd Unit 8 Nahant, MA 01908
Estimated Value: $366,202 - $493,000
1
Bed
1
Bath
853
Sq Ft
$487/Sq Ft
Est. Value
About This Home
This home is located at 162 Willow Rd Unit 8, Nahant, MA 01908 and is currently estimated at $415,301, approximately $486 per square foot. 162 Willow Rd Unit 8 is a home located in Essex County with nearby schools including Johnson Elementary School, Swampscott Middle School, and Swampscott High School.
Ownership History
Date
Name
Owned For
Owner Type
Purchase Details
Closed on
Mar 26, 2010
Sold by
Anderson Christopher B
Bought by
Santos Manuel
Current Estimated Value
Home Financials for this Owner
Home Financials are based on the most recent Mortgage that was taken out on this home.
Original Mortgage
$127,200
Outstanding Balance
$84,803
Interest Rate
5.02%
Mortgage Type
Purchase Money Mortgage
Estimated Equity
$330,498
Purchase Details
Closed on
Mar 16, 2007
Sold by
Lewis Amy
Bought by
Anderson Christopher B
Home Financials for this Owner
Home Financials are based on the most recent Mortgage that was taken out on this home.
Original Mortgage
$208,550
Interest Rate
6.4%
Mortgage Type
Purchase Money Mortgage
Purchase Details
Closed on
Sep 14, 2001
Sold by
Solimne David J and Solimne Patricia
Bought by
Lewis Amy
Home Financials for this Owner
Home Financials are based on the most recent Mortgage that was taken out on this home.
Original Mortgage
$148,900
Interest Rate
6.99%
Mortgage Type
Purchase Money Mortgage
Create a Home Valuation Report for This Property
The Home Valuation Report is an in-depth analysis detailing your home's value as well as a comparison with similar homes in the area
Home Values in the Area
Average Home Value in this Area
Purchase History
| Date | Buyer | Sale Price | Title Company |
|---|---|---|---|
| Santos Manuel | $212,000 | -- | |
| Anderson Christopher B | $215,000 | -- | |
| Anderson Christopher B | $215,000 | -- | |
| Lewis Amy | $165,900 | -- |
Source: Public Records
Mortgage History
| Date | Status | Borrower | Loan Amount |
|---|---|---|---|
| Open | Santos Manuel | $127,200 | |
| Previous Owner | Anderson Christopher B | $208,550 | |
| Previous Owner | Lewis Amy | $148,900 |
Source: Public Records
Tax History Compared to Growth
Tax History
| Year | Tax Paid | Tax Assessment Tax Assessment Total Assessment is a certain percentage of the fair market value that is determined by local assessors to be the total taxable value of land and additions on the property. | Land | Improvement |
|---|---|---|---|---|
| 2025 | $2,815 | $307,600 | $0 | $307,600 |
| 2024 | $2,790 | $307,600 | $0 | $307,600 |
| 2023 | $2,593 | $285,300 | $0 | $285,300 |
| 2022 | $2,749 | $280,800 | $0 | $280,800 |
| 2021 | $2,951 | $280,800 | $0 | $280,800 |
| 2020 | $3,235 | $294,900 | $0 | $294,900 |
| 2019 | $2,520 | $231,000 | $0 | $231,000 |
| 2018 | $2,171 | $211,800 | $0 | $211,800 |
| 2017 | $2,218 | $211,800 | $0 | $211,800 |
| 2016 | $2,127 | $202,200 | $0 | $202,200 |
| 2015 | $2,115 | $193,700 | $0 | $193,700 |
| 2014 | $2,081 | $188,700 | $0 | $188,700 |
Source: Public Records
Map
Nearby Homes
- 303 Nahant Rd
- 51 Cliff St
- 3 Cliff St
- 66 Ocean St
- 2 Goddard Dr
- 183 Bass Point Rd
- 17 Pearl Rd
- 23 Phillips Rd
- 43 Maple Ave
- 9 Little Nahant Rd
- 36 Lennox Rd
- 9 Beach Rd Unit 4
- 45 Tudor St Unit 3-8
- 41 Tudor St
- 12 Chancery Ct Unit 205
- 12 Chancery Ct Unit 207
- 300 Lynn Shore Dr Unit 612
- 285 Lynn Shore Dr Unit 508
- 285 Lynn Shore Dr Unit 203
- 281 Lynn Shore Dr Unit 4
- 162 Willow Rd Unit 8
- 162 Willow Rd Unit 11
- 162 Willow Rd Unit 10
- 162 Willow Rd Unit 9
- 162 Willow Rd Unit 7
- 162 Willow Rd Unit 6
- 162 Willow Rd Unit 5
- 162 Willow Rd Unit 4
- 162 Willow Rd Unit 3
- 162 Willow Rd Unit 1
- 158 Willow Rd
- 156 Willow Rd
- 164 Willow Rd
- 0 Christopher Dr
- 31 Wharf St
- 152 Willow Rd
- 2 Christopher Dr
- 35 Wharf St
- 167 Willow Rd
- 166 Willow Rd