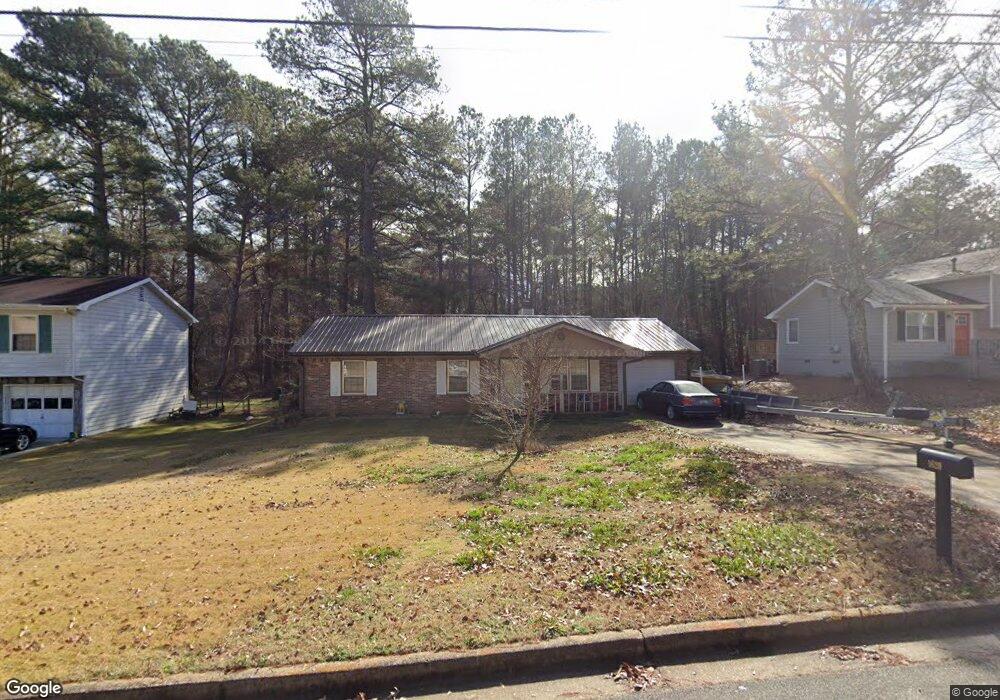
1620 Cherry Hill Ct SW Unit 1 Conyers, GA 30094
Estimated Value: $221,000 - $230,942
3
Beds
2
Baths
1,500
Sq Ft
$150/Sq Ft
Est. Value
About This Home
This home is located at 1620 Cherry Hill Ct SW Unit 1, Conyers, GA 30094 and is currently estimated at $225,736, approximately $150 per square foot. 1620 Cherry Hill Ct SW Unit 1 is a home located in Rockdale County with nearby schools including Sims Elementary School, Edwards Middle School, and Heritage High School.
Ownership History
Date
Name
Owned For
Owner Type
Purchase Details
Closed on
Jan 29, 2004
Sold by
Mehra Rajan and Mehra Sheela
Bought by
Smith Francois
Current Estimated Value
Home Financials for this Owner
Home Financials are based on the most recent Mortgage that was taken out on this home.
Original Mortgage
$104,139
Outstanding Balance
$48,909
Interest Rate
5.85%
Mortgage Type
FHA
Estimated Equity
$176,827
Purchase Details
Closed on
Oct 16, 2001
Sold by
Harris Sean D and Harris Stephanie
Bought by
Pope Anthony L
Home Financials for this Owner
Home Financials are based on the most recent Mortgage that was taken out on this home.
Original Mortgage
$111,373
Interest Rate
6.87%
Mortgage Type
New Conventional
Purchase Details
Closed on
Jan 31, 2001
Sold by
Cronin Terry L
Bought by
Mehra Ranjan and Mehra Sheela
Home Financials for this Owner
Home Financials are based on the most recent Mortgage that was taken out on this home.
Original Mortgage
$90,538
Interest Rate
7.18%
Mortgage Type
FHA
Create a Home Valuation Report for This Property
The Home Valuation Report is an in-depth analysis detailing your home's value as well as a comparison with similar homes in the area
Home Values in the Area
Average Home Value in this Area
Purchase History
| Date | Buyer | Sale Price | Title Company |
|---|---|---|---|
| Smith Francois | $105,900 | -- | |
| Pope Anthony L | $113,200 | -- | |
| Mehra Ranjan | $92,000 | -- |
Source: Public Records
Mortgage History
| Date | Status | Borrower | Loan Amount |
|---|---|---|---|
| Open | Smith Francois | $104,139 | |
| Previous Owner | Pope Anthony L | $111,373 | |
| Previous Owner | Mehra Ranjan | $90,538 |
Source: Public Records
Tax History Compared to Growth
Tax History
| Year | Tax Paid | Tax Assessment Tax Assessment Total Assessment is a certain percentage of the fair market value that is determined by local assessors to be the total taxable value of land and additions on the property. | Land | Improvement |
|---|---|---|---|---|
| 2024 | $2,078 | $88,240 | $15,720 | $72,520 |
| 2023 | $1,728 | $77,200 | $14,760 | $62,440 |
| 2022 | $1,274 | $59,520 | $11,120 | $48,400 |
| 2021 | $1,079 | $49,600 | $8,920 | $40,680 |
| 2020 | $909 | $44,720 | $7,480 | $37,240 |
| 2019 | $909 | $44,000 | $6,760 | $37,240 |
| 2018 | $682 | $36,480 | $4,560 | $31,920 |
| 2017 | $684 | $36,240 | $4,560 | $31,680 |
| 2016 | $632 | $36,240 | $4,560 | $31,680 |
| 2015 | $353 | $26,560 | $3,120 | $23,440 |
| 2014 | $321 | $26,560 | $3,120 | $23,440 |
| 2013 | -- | $29,800 | $6,000 | $23,800 |
Source: Public Records
Map
Nearby Homes
- 1624 Sugarmaple Ln SW
- 1598 Cherry Hill Ln SW Unit 5
- 1593 Cherry Hill Ln SW
- 170 Old Mill Trail SW
- 1461 Cherry Hill Rd SW
- 2370 Ebenezer Rd SE
- 1806 Mccollum Rd SW
- 1675 Mccollum Rd SW
- 2305 Lochinver Ln SW
- 309 Windsor Walk SE Unit 1
- 325 Yukon Dr Unit 66
- 335 Yukon Dr Unit 61
- 341 Yukon Dr Unit 58
- 4980 SE West Lake Dr
- 4811 SE West Lake Dr
- 2203 Liberty Ln SW Unit 2
- 340 Windsor Walk SE
- 2315 Lochinver Ln SW
- 2067 Ebenezer Rd SW
- 2631 Rolling Hills Way SE
- 1616 Cherry Hill Ct SW Unit 1
- 1628 Cherry Hill Ct SW
- 1612 Cherry Hill Ct SW Unit 1
- 1619 Cherry Hill Ct SW
- 1623 Cherry Hill Ct SW Unit 1
- 1632 Cherry Hill Ct SW
- 1608 Cherry Hill Ct SW
- 1627 Cherry Hill Ct SW
- 1631 Cherry Hill Ct SW Unit 1
- 1607 Cherry Hill Ct SW
- 1636 Cherry Hill Ct SW Unit 1
- 1604 Cherry Hill Ct SW
- 1620 Sugarmaple Ln SW
- 1616 Sugarmaple Ln SW
- 1635 Cherry Hill Ct SW
- 1603 Cherry Hill Ct SW
- 1628 Sugarmaple Ln SW Unit 2
- 1612 Sugarmaple Ln SW Unit 108
- 1612 Sugarmaple Ln SW
- 1600 Cherry Hill Ct SW