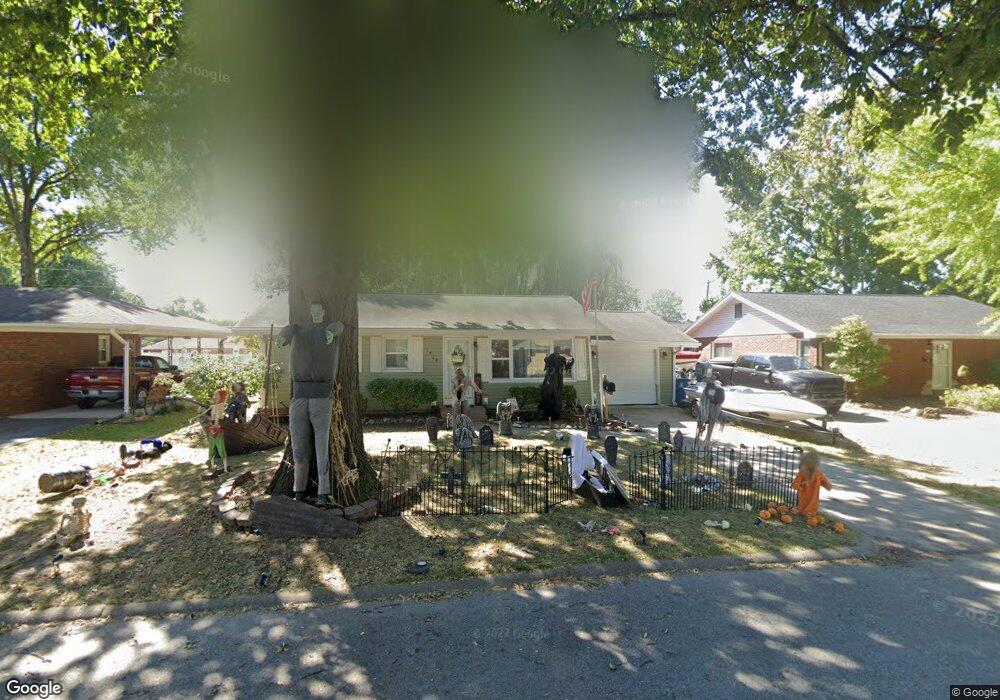
1620 Clark Ave Granite City, IL 62040
Estimated Value: $139,000 - $180,000
2
Beds
3
Baths
1,296
Sq Ft
$122/Sq Ft
Est. Value
About This Home
This home is located at 1620 Clark Ave, Granite City, IL 62040 and is currently estimated at $157,931, approximately $121 per square foot. 1620 Clark Ave is a home located in Madison County with nearby schools including Granite City High School, Metro East Montessori School, and St. Elizabeth Elementary School.
Ownership History
Date
Name
Owned For
Owner Type
Purchase Details
Closed on
Aug 14, 2018
Sold by
Lathrop Stephen W
Bought by
Hooper Travis S and Hooper Ann
Current Estimated Value
Home Financials for this Owner
Home Financials are based on the most recent Mortgage that was taken out on this home.
Original Mortgage
$102,820
Outstanding Balance
$89,295
Interest Rate
4.5%
Mortgage Type
New Conventional
Estimated Equity
$68,636
Purchase Details
Closed on
Jan 6, 2016
Sold by
Hooper Michelle Francis
Bought by
Lathrop Stephen W
Purchase Details
Closed on
Jan 13, 2006
Sold by
Hooper Michelle Francis
Bought by
Krause Carol F and Hooper Michelle Francis
Purchase Details
Closed on
May 15, 2005
Sold by
United Community Bank
Bought by
Hooper Michelle Francis
Purchase Details
Closed on
Dec 22, 2004
Sold by
Krause Carol F
Bought by
United Community Bank and Trust #499-115
Purchase Details
Closed on
Jan 17, 2003
Sold by
Hoffman Lois
Bought by
Seitzer Laura L
Create a Home Valuation Report for This Property
The Home Valuation Report is an in-depth analysis detailing your home's value as well as a comparison with similar homes in the area
Home Values in the Area
Average Home Value in this Area
Purchase History
| Date | Buyer | Sale Price | Title Company |
|---|---|---|---|
| Hooper Travis S | $106,000 | Pontoon Title | |
| Lathrop Stephen W | $45,000 | Pontoon Title Company | |
| Krause Carol F | -- | Pontoon Title Co | |
| Hooper Michelle Francis | -- | -- | |
| United Community Bank | -- | Pontoon Title Co | |
| Krause Carol F | $70,000 | Pontoon Title Co | |
| Seitzer Laura L | -- | Metro Title & Escrow Company |
Source: Public Records
Mortgage History
| Date | Status | Borrower | Loan Amount |
|---|---|---|---|
| Open | Hooper Travis S | $102,820 |
Source: Public Records
Tax History Compared to Growth
Tax History
| Year | Tax Paid | Tax Assessment Tax Assessment Total Assessment is a certain percentage of the fair market value that is determined by local assessors to be the total taxable value of land and additions on the property. | Land | Improvement |
|---|---|---|---|---|
| 2024 | $2,932 | $39,640 | $6,800 | $32,840 |
| 2023 | $2,932 | $35,730 | $6,130 | $29,600 |
| 2022 | $2,831 | $32,740 | $5,620 | $27,120 |
| 2021 | $2,555 | $30,700 | $5,270 | $25,430 |
| 2020 | $2,467 | $29,320 | $5,030 | $24,290 |
| 2019 | $2,361 | $27,790 | $4,770 | $23,020 |
| 2018 | $2,939 | $26,980 | $4,630 | $22,350 |
| 2017 | $2,884 | $27,980 | $4,800 | $23,180 |
| 2016 | $2,185 | $26,790 | $4,800 | $21,990 |
| 2015 | $1,496 | $26,790 | $4,800 | $21,990 |
| 2014 | $1,496 | $26,790 | $4,800 | $21,990 |
| 2013 | $1,496 | $26,790 | $4,800 | $21,990 |
Source: Public Records
Map
Nearby Homes
- 3424 Lydia Ln
- 9 Mercer Dr
- 3321 Wabash Ave
- 1511 Cottage Ave
- 1517 Garfield Ave
- 50 Janday Ln
- 3127 Wayne Ave
- 3401 Franklin Ave
- 3805 Fair Oaks Dr
- 3128 Carlson Ave
- 52 Villa Dr
- 1737 Moro Ave
- 3028 Wayne Ave
- 3365 Colgate Place
- 3043 Myrtle Ave
- 3017 Wayne Ave
- 1612 Mitchell Ave
- 440 Wilson Park Ln
- 3247 Erin Dr
- 3321 Princeton Dr
- 1624 Clark Ave
- 1614 Clark Ave
- 6 Country Lane Ct
- 5 Country Lane Ct
- 1628 Clark Ave
- 1612 Clark Ave
- 7 Country Lane Ct
- 1636 Clark Ave
- 4 Country Lane Ct
- 7 Country Ln
- 1608 Clark Ave
- 1720 Garfield Ave
- 3 Country Lane Ct
- 8 Country Lane Ct
- 1615 Clark Ave
- 3317 Lydia Ln
- 3313 Lydia Ln
- 1703 Clark Ave
- 1640 Clark Ave
- 1604 Clark Ave