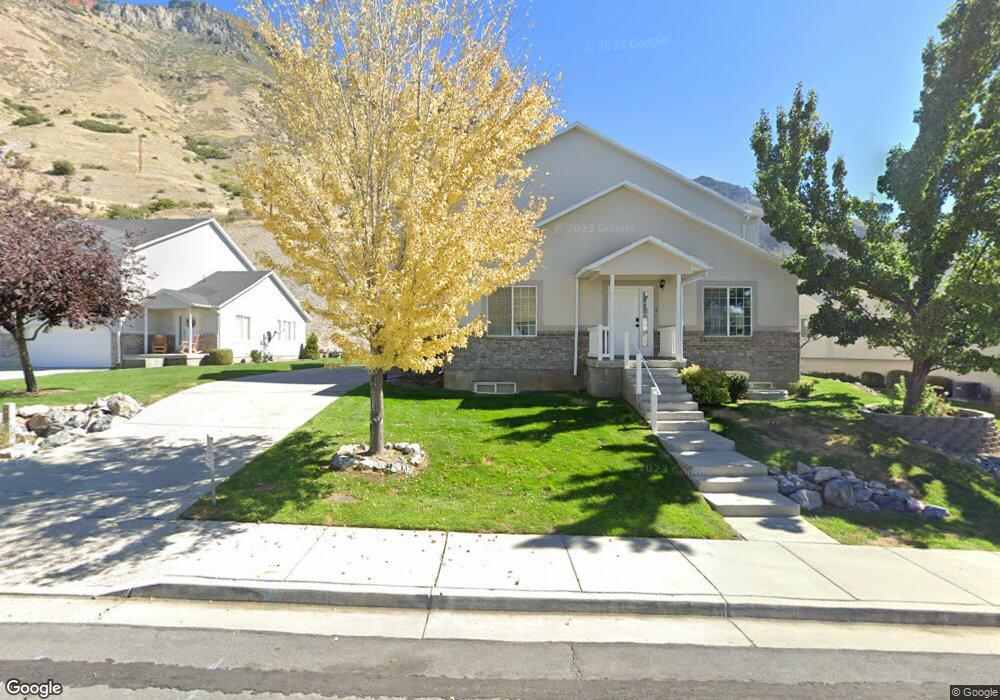
1620 N 100 E Springville, UT 84663
Little Rock Canyon NeighborhoodEstimated Value: $417,000 - $448,000
3
Beds
3
Baths
2,364
Sq Ft
$185/Sq Ft
Est. Value
About This Home
This home is located at 1620 N 100 E, Springville, UT 84663 and is currently estimated at $436,291, approximately $184 per square foot. 1620 N 100 E is a home located in Utah County with nearby schools including Cherry Creek Elementary School, Springville Junior High School, and Springville High School.
Ownership History
Date
Name
Owned For
Owner Type
Purchase Details
Closed on
Feb 11, 2013
Sold by
Mills James J and Mills Cecelia
Bought by
Byrd Charles Michael
Current Estimated Value
Home Financials for this Owner
Home Financials are based on the most recent Mortgage that was taken out on this home.
Original Mortgage
$147,184
Outstanding Balance
$102,125
Interest Rate
3.25%
Mortgage Type
FHA
Estimated Equity
$334,166
Purchase Details
Closed on
Jun 24, 2004
Sold by
Mills James J
Bought by
Mills James J and Mills Cecelia
Home Financials for this Owner
Home Financials are based on the most recent Mortgage that was taken out on this home.
Original Mortgage
$123,200
Interest Rate
7.75%
Mortgage Type
Purchase Money Mortgage
Create a Home Valuation Report for This Property
The Home Valuation Report is an in-depth analysis detailing your home's value as well as a comparison with similar homes in the area
Home Values in the Area
Average Home Value in this Area
Purchase History
| Date | Buyer | Sale Price | Title Company |
|---|---|---|---|
| Byrd Charles Michael | -- | None Available | |
| Mills James J | -- | Title West Title Company | |
| Mills James J | -- | Title West Title Company |
Source: Public Records
Mortgage History
| Date | Status | Borrower | Loan Amount |
|---|---|---|---|
| Open | Byrd Charles Michael | $147,184 | |
| Previous Owner | Mills James J | $123,200 | |
| Closed | Mills James J | $30,800 |
Source: Public Records
Tax History
| Year | Tax Paid | Tax Assessment Tax Assessment Total Assessment is a certain percentage of the fair market value that is determined by local assessors to be the total taxable value of land and additions on the property. | Land | Improvement |
|---|---|---|---|---|
| 2025 | $2,240 | $221,100 | -- | -- |
| 2024 | $2,240 | $229,515 | $0 | $0 |
| 2023 | $2,163 | $221,815 | $0 | $0 |
| 2022 | $2,242 | $225,830 | $0 | $0 |
| 2021 | $2,023 | $317,100 | $50,000 | $267,100 |
| 2020 | $1,830 | $278,200 | $50,000 | $228,200 |
| 2019 | $1,674 | $259,000 | $50,000 | $209,000 |
| 2018 | $1,574 | $232,300 | $50,000 | $182,300 |
| 2017 | $1,594 | $125,015 | $0 | $0 |
| 2016 | $1,384 | $106,425 | $0 | $0 |
| 2015 | $1,309 | $102,850 | $0 | $0 |
| 2014 | $1,254 | $97,900 | $0 | $0 |
Source: Public Records
Map
Nearby Homes
- 1404 N Spring Mountain Dr
- 1025 N 300 W Unit 108
- 1025 N 300 W Unit 7
- 1025 N 300 W Unit 1
- 1083 N 700 E
- 850 N Main St Unit 47
- 814 N 175 E
- 164 E 750 N
- 778 N 250 W
- 576 N 100 E
- 512 N 400 E
- 519 N 600 E
- 663 N 880 E
- 437 N 650 St E
- 58 W 300 N
- 711 E 400 N
- 2030 Nevada Cir
- 231 N 100 W
- 2176 Mountain Vista Ln
- 380 E 200 N
Your Personal Tour Guide
Ask me questions while you tour the home.