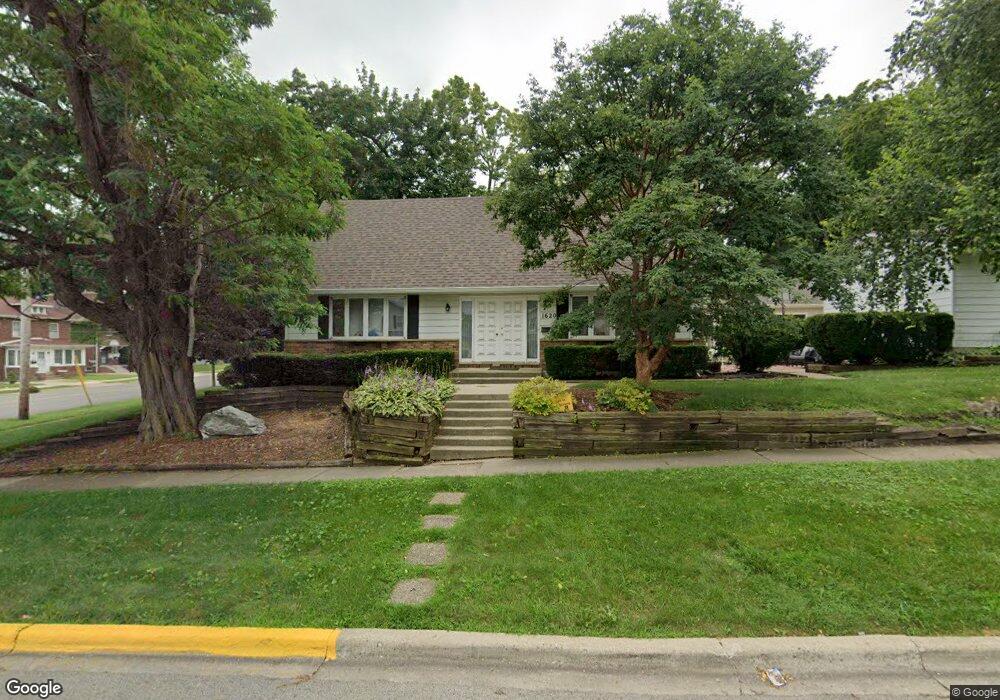
1620 N Sheridan Rd Waukegan, IL 60085
Estimated Value: $249,000 - $300,000
3
Beds
2
Baths
1,386
Sq Ft
$206/Sq Ft
Est. Value
About This Home
This home is located at 1620 N Sheridan Rd, Waukegan, IL 60085 and is currently estimated at $285,228, approximately $205 per square foot. 1620 N Sheridan Rd is a home located in Lake County with nearby schools including Greenwood Elementary School, Edith M Smith Middle School, and Waukegan High School.
Ownership History
Date
Name
Owned For
Owner Type
Purchase Details
Closed on
Jul 25, 2006
Sold by
Kolf Peter R and Kolf Michele M
Bought by
Kelly Perry K and Kelly Dyonna A
Current Estimated Value
Home Financials for this Owner
Home Financials are based on the most recent Mortgage that was taken out on this home.
Original Mortgage
$209,699
Outstanding Balance
$125,863
Interest Rate
6.85%
Mortgage Type
FHA
Estimated Equity
$159,365
Purchase Details
Closed on
Apr 19, 1996
Sold by
Scherman Terry R and Scherman Janet
Bought by
Kolf Peter R and Kolf Michele M
Home Financials for this Owner
Home Financials are based on the most recent Mortgage that was taken out on this home.
Original Mortgage
$75,000
Interest Rate
7.91%
Create a Home Valuation Report for This Property
The Home Valuation Report is an in-depth analysis detailing your home's value as well as a comparison with similar homes in the area
Home Values in the Area
Average Home Value in this Area
Purchase History
| Date | Buyer | Sale Price | Title Company |
|---|---|---|---|
| Kelly Perry K | $213,000 | None Available | |
| Kolf Peter R | -- | -- | |
| Kolf Peter R | $133,000 | -- | |
| Kolf Peter R | $133,000 | -- |
Source: Public Records
Mortgage History
| Date | Status | Borrower | Loan Amount |
|---|---|---|---|
| Open | Kelly Perry K | $209,699 | |
| Previous Owner | Kolf Peter R | $75,000 |
Source: Public Records
Tax History Compared to Growth
Tax History
| Year | Tax Paid | Tax Assessment Tax Assessment Total Assessment is a certain percentage of the fair market value that is determined by local assessors to be the total taxable value of land and additions on the property. | Land | Improvement |
|---|---|---|---|---|
| 2024 | $6,126 | $80,912 | $12,298 | $68,614 |
| 2023 | $6,459 | $72,970 | $11,090 | $61,880 |
| 2022 | $6,459 | $72,067 | $13,276 | $58,791 |
| 2021 | $6,086 | $64,374 | $11,843 | $52,531 |
| 2020 | $6,118 | $59,972 | $11,033 | $48,939 |
| 2019 | $6,105 | $54,955 | $10,110 | $44,845 |
| 2018 | $5,548 | $49,290 | $12,945 | $36,345 |
| 2017 | $5,350 | $43,608 | $11,453 | $32,155 |
| 2016 | $4,929 | $37,893 | $9,952 | $27,941 |
| 2015 | $4,715 | $33,915 | $8,907 | $25,008 |
| 2014 | $4,166 | $30,164 | $8,421 | $21,743 |
| 2012 | $5,907 | $32,680 | $9,124 | $23,556 |
Source: Public Records
Map
Nearby Homes
- 1613 North Ave
- 616 W Keith Ave
- 1336 N Ash St
- 1335 Chestnut St
- 1110 N Ash St
- 1018 W Atlantic Ave
- 415 W Ridgeland Ave
- 1905 Linden Ave
- 1312 N Linden Ave
- 2213 Alta Vista Dr
- 918 N Ash St
- 2246 Alta Vista Dr
- 1105 Woodlawn Cir
- 723 N County St
- 2232 Walnut St
- 325 4th St
- 917 N Linden Ave
- 1504 W Glen Flora Ave
- 1000 Pine St
- 611 N Genesee St
- 1612 N Sheridan Rd
- 1610 N Sheridan Rd
- 263 E Keith Ave
- 238 E Keith Ave
- 1613 Alexander Ct
- 242 E Keith Ave
- 246 E Keith Ave
- 1609 Alexander Ct
- 1600 N Sheridan Rd
- 1623 N Sheridan Rd
- 1615 N Sheridan Rd
- 1603 Alexander Ct
- 1611 N Sheridan Rd
- 250 E Keith Ave
- 1601 Alexander Ct
- 254 E Keith Ave
- 1609 N Sheridan Rd
- 221 E Keith Ave
- 300 W Keith Ave
- 1601 N Sheridan Rd