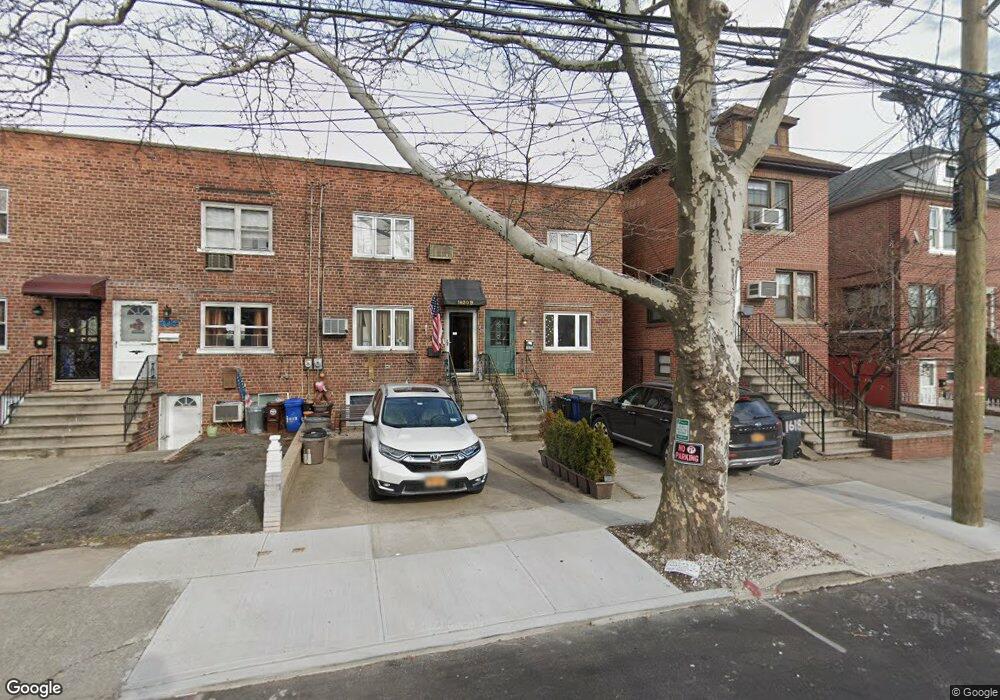
1620 Paulding Ave Unit A Bronx, NY 10462
Morris Park NeighborhoodEstimated Value: $652,538 - $907,000
2
Beds
1
Bath
1,440
Sq Ft
$517/Sq Ft
Est. Value
About This Home
This home is located at 1620 Paulding Ave Unit A, Bronx, NY 10462 and is currently estimated at $744,135, approximately $516 per square foot. 1620 Paulding Ave Unit A is a home located in Bronx County with nearby schools including P.S. 083 The Donald Hertz School, Icahn Charter School 2, and St Raymond Elementary School.
Ownership History
Date
Name
Owned For
Owner Type
Purchase Details
Closed on
Jul 21, 2017
Sold by
Anthony Napoli Deceased and Anthony Napoli Napoli
Bought by
Vitucci Louis A and Vitucci Nicholas J
Current Estimated Value
Home Financials for this Owner
Home Financials are based on the most recent Mortgage that was taken out on this home.
Original Mortgage
$277,200
Outstanding Balance
$230,433
Interest Rate
3.91%
Mortgage Type
New Conventional
Estimated Equity
$513,702
Purchase Details
Closed on
Apr 30, 1999
Sold by
Berardi Anna and Argentieri Rose
Bought by
Napoli Anthony and Napoli Theresa
Home Financials for this Owner
Home Financials are based on the most recent Mortgage that was taken out on this home.
Original Mortgage
$136,000
Interest Rate
7.61%
Mortgage Type
Purchase Money Mortgage
Create a Home Valuation Report for This Property
The Home Valuation Report is an in-depth analysis detailing your home's value as well as a comparison with similar homes in the area
Home Values in the Area
Average Home Value in this Area
Purchase History
| Date | Buyer | Sale Price | Title Company |
|---|---|---|---|
| Vitucci Louis A | $346,500 | -- | |
| Vitucci Louis A | $346,500 | -- | |
| Napoli Anthony | $160,000 | The Judicial Title Ins Agenc | |
| Napoli Anthony | $160,000 | The Judicial Title Ins Agenc |
Source: Public Records
Mortgage History
| Date | Status | Borrower | Loan Amount |
|---|---|---|---|
| Open | Vitucci Louis A | $277,200 | |
| Closed | Vitucci Louis A | $277,200 | |
| Previous Owner | Napoli Anthony | $136,000 |
Source: Public Records
Tax History Compared to Growth
Tax History
| Year | Tax Paid | Tax Assessment Tax Assessment Total Assessment is a certain percentage of the fair market value that is determined by local assessors to be the total taxable value of land and additions on the property. | Land | Improvement |
|---|---|---|---|---|
| 2025 | $6,271 | $32,931 | $7,233 | $25,698 |
| 2024 | $6,271 | $31,220 | $7,077 | $24,143 |
| 2023 | $5,743 | $31,220 | $7,181 | $24,039 |
| 2022 | $5,393 | $30,900 | $8,460 | $22,440 |
| 2021 | $5,618 | $27,240 | $8,460 | $18,780 |
| 2020 | $5,331 | $29,880 | $8,460 | $21,420 |
| 2019 | $4,970 | $27,240 | $8,460 | $18,780 |
| 2018 | $4,843 | $23,760 | $7,901 | $15,859 |
| 2017 | $4,638 | $22,752 | $7,113 | $15,639 |
| 2016 | $4,447 | $22,247 | $8,064 | $14,183 |
| 2015 | $2,589 | $20,988 | $9,308 | $11,680 |
| 2014 | $2,589 | $19,800 | $9,420 | $10,380 |
Source: Public Records
Map
Nearby Homes
- 1617 Hone Ave
- 1639 Hone Ave
- 1633 Lurting Ave
- 1570 Colden Ave
- 987 Pierce Ave
- 1570 Paulding Ave
- 1630 Radcliff Ave
- 1657 Colden Ave
- 1629 Haight Ave
- 989 Sacket Ave
- 987 van Nest Ave
- 976 Sackett Ave
- 1725 Hone Ave
- 1725 Paulding Ave
- 1531 Hone Ave
- 1569 Bogart Ave
- 959 van Nest Ave
- 1726 Radcliff Ave
- Bronx Park East Street Unit 6J
- 1636 Williamsbridge Rd
- 1620A Paulding Ave
- 1620B Paulding Ave
- 1618 Paulding Ave
- 1622 Paulding Ave
- 1616 Paulding Ave
- 1624 Paulding Ave
- 1626 Paulding Ave
- 1614 Paulding Ave
- 1628 Paulding Ave
- 1612 Paulding Ave
- 1623 Hone Ave
- 1621 Hone Ave
- 1625 Hone Ave
- 1619 Hone Ave
- 1627 Hone Ave
- 1630 Paulding Ave
- 1610 Paulding Ave
- 1633 Hone Ave
- 1635 Hone Ave
- 1615 Hone Ave