Estimated Value: $344,125 - $379,000
3
Beds
2
Baths
1,354
Sq Ft
$263/Sq Ft
Est. Value
About This Home
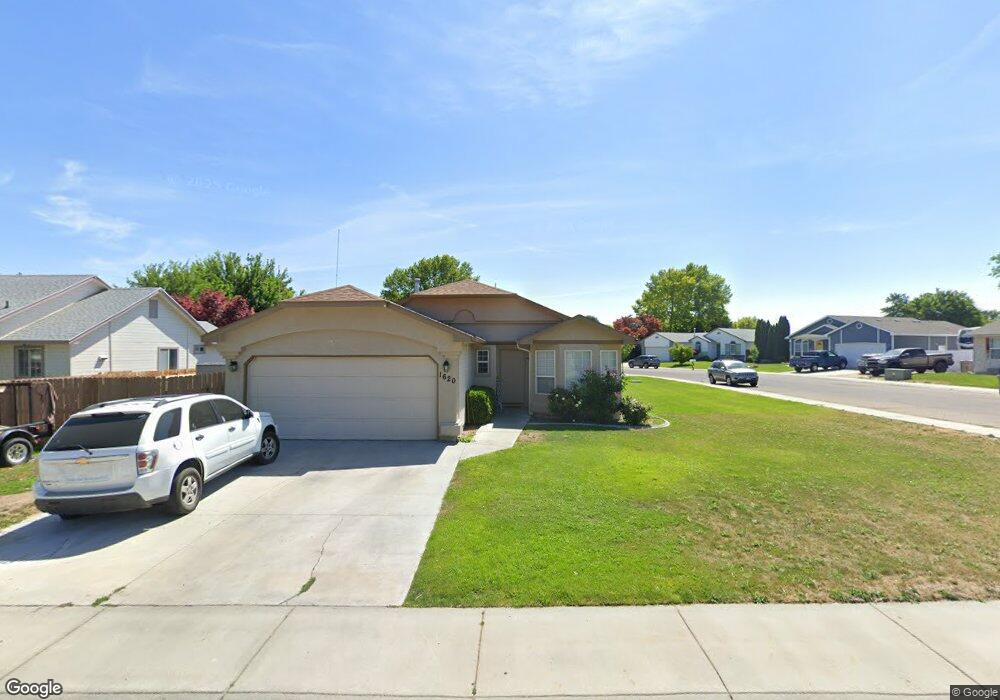
This home is located at 1620 Ruby Ct, Nampa, ID 83686 and is currently estimated at $356,031, approximately $262 per square foot. 1620 Ruby Ct is a home located in Canyon County with nearby schools including Iowa Elementary School, South Middle School, and Skyview High School.
Ownership History
Date
Name
Owned For
Owner Type
Purchase Details
Closed on
Apr 4, 2025
Sold by
Marshall Shane K
Bought by
Mountain View Rentals Llc
Current Estimated Value
Purchase Details
Closed on
Sep 29, 2020
Sold by
Marshall Amber R
Bought by
Marshall Shane K
Home Financials for this Owner
Home Financials are based on the most recent Mortgage that was taken out on this home.
Original Mortgage
$187,500
Interest Rate
2.9%
Mortgage Type
New Conventional
Purchase Details
Closed on
Sep 28, 2020
Sold by
Marshall Amber R
Bought by
Marshall Shane K
Home Financials for this Owner
Home Financials are based on the most recent Mortgage that was taken out on this home.
Original Mortgage
$187,500
Interest Rate
2.9%
Mortgage Type
New Conventional
Purchase Details
Closed on
Sep 24, 2019
Sold by
Marshall Kem L and Marshall Lois E
Bought by
Marshall Shane K and Marshall Amber R
Create a Home Valuation Report for This Property
The Home Valuation Report is an in-depth analysis detailing your home's value as well as a comparison with similar homes in the area
Home Values in the Area
Average Home Value in this Area
Purchase History
| Date | Buyer | Sale Price | Title Company |
|---|---|---|---|
| Mountain View Rentals Llc | -- | Pioneer Title | |
| Marshall Shane K | -- | Pioneer Ttl Canyon Caldwell | |
| Marshall Shane K | -- | Pioneer Title | |
| Marshall Shane K | -- | Accommodation |
Source: Public Records
Mortgage History
| Date | Status | Borrower | Loan Amount |
|---|---|---|---|
| Previous Owner | Marshall Shane K | $187,500 | |
| Previous Owner | Marshall Shane K | $187,500 |
Source: Public Records
Tax History
| Year | Tax Paid | Tax Assessment Tax Assessment Total Assessment is a certain percentage of the fair market value that is determined by local assessors to be the total taxable value of land and additions on the property. | Land | Improvement |
|---|---|---|---|---|
| 2025 | $2,237 | $324,900 | $108,000 | $216,900 |
| 2024 | $2,237 | $312,700 | $96,000 | $216,700 |
| 2023 | $2,418 | $321,000 | $96,000 | $225,000 |
| 2022 | $2,534 | $343,300 | $108,000 | $235,300 |
| 2021 | $2,819 | $239,300 | $48,000 | $191,300 |
| 2020 | $2,459 | $189,900 | $39,000 | $150,900 |
| 2019 | $2,778 | $173,100 | $33,500 | $139,600 |
| 2018 | $2,794 | $0 | $0 | $0 |
| 2017 | $2,613 | $0 | $0 | $0 |
| 2016 | $2,410 | $0 | $0 | $0 |
| 2015 | $2,135 | $0 | $0 | $0 |
| 2014 | $1,988 | $102,000 | $19,500 | $82,500 |
Source: Public Records
Map
Nearby Homes
- 1003 E Iowa Ave
- 1415/1411 S Fern St
- 1407 S Elder St
- 1304 S Holly St
- 1228 E Pennsylvania Place
- 1426 E Sharons Loop
- 1705 S Florence St
- 2210 Glenview Dr
- 2113 S Powerline Rd
- 525 E Greenhurst Rd
- 1518 E Florida Ave
- 1616 E Florida Ave
- 915 E Amity Ave
- 1103 E Clark Ave
- 703 S Almond
- 1604 E Amity Ave
- 2718 S Banner Ct
- 2510 San Marco Way
- 2105 E Maryland Ave
- 607 S Powerline Rd
Your Personal Tour Guide
Ask me questions while you tour the home.