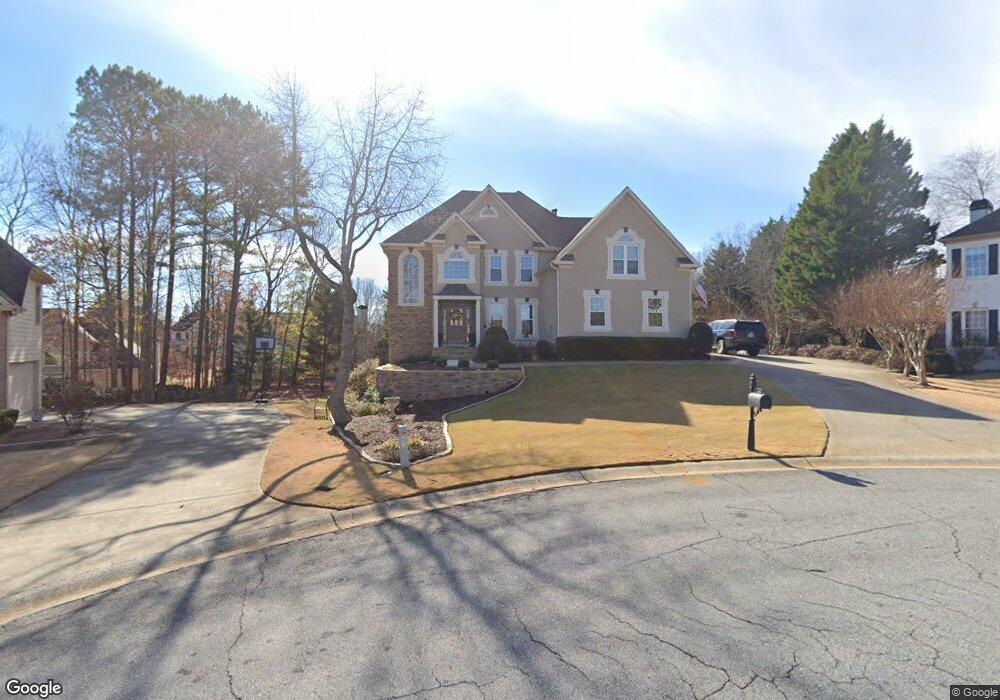
1620 Shadow Brook Way Alpharetta, GA 30005
Big Creek NeighborhoodEstimated Value: $616,000 - $675,000
4
Beds
3
Baths
2,702
Sq Ft
$239/Sq Ft
Est. Value
About This Home
This home is located at 1620 Shadow Brook Way, Alpharetta, GA 30005 and is currently estimated at $644,933, approximately $238 per square foot. 1620 Shadow Brook Way is a home located in Forsyth County with nearby schools including Brookwood Elementary School, Piney Grove Middle School, and Denmark High School.
Ownership History
Date
Name
Owned For
Owner Type
Purchase Details
Closed on
Nov 14, 2003
Sold by
Cartmill Ken
Bought by
Stirrup John S and Stirrup Vineta
Current Estimated Value
Home Financials for this Owner
Home Financials are based on the most recent Mortgage that was taken out on this home.
Original Mortgage
$192,000
Interest Rate
6.25%
Mortgage Type
New Conventional
Purchase Details
Closed on
Jan 30, 1998
Sold by
Security State Bk
Bought by
Cartmill Ken
Home Financials for this Owner
Home Financials are based on the most recent Mortgage that was taken out on this home.
Original Mortgage
$180,300
Interest Rate
7.01%
Mortgage Type
New Conventional
Purchase Details
Closed on
Jan 25, 1995
Sold by
Falling Water Invest
Bought by
Saxton Homes Inc
Home Financials for this Owner
Home Financials are based on the most recent Mortgage that was taken out on this home.
Original Mortgage
$155,250
Interest Rate
9.24%
Mortgage Type
Small Business Administration
Purchase Details
Closed on
Jul 31, 1990
Sold by
Butler Dean W and Butler Susan
Bought by
Marcus Mary A
Create a Home Valuation Report for This Property
The Home Valuation Report is an in-depth analysis detailing your home's value as well as a comparison with similar homes in the area
Home Values in the Area
Average Home Value in this Area
Purchase History
| Date | Buyer | Sale Price | Title Company |
|---|---|---|---|
| Stirrup John S | $262,000 | -- | |
| Cartmill Ken | $185,900 | -- | |
| Saxton Homes Inc | $38,900 | -- | |
| Marcus Mary A | -- | None Listed On Document | |
| Marcus Mary A | -- | None Listed On Document |
Source: Public Records
Mortgage History
| Date | Status | Borrower | Loan Amount |
|---|---|---|---|
| Previous Owner | Stirrup John S | $192,000 | |
| Previous Owner | Cartmill Ken | $180,300 | |
| Previous Owner | Saxton Homes Inc | $155,250 |
Source: Public Records
Tax History Compared to Growth
Tax History
| Year | Tax Paid | Tax Assessment Tax Assessment Total Assessment is a certain percentage of the fair market value that is determined by local assessors to be the total taxable value of land and additions on the property. | Land | Improvement |
|---|---|---|---|---|
| 2025 | $4,849 | $253,540 | $74,000 | $179,540 |
| 2024 | $4,849 | $242,816 | $68,000 | $174,816 |
| 2023 | $4,076 | $217,728 | $60,000 | $157,728 |
| 2022 | $4,204 | $154,392 | $40,000 | $114,392 |
| 2021 | $3,819 | $154,392 | $40,000 | $114,392 |
| 2020 | $3,691 | $148,216 | $40,000 | $108,216 |
| 2019 | $3,789 | $152,640 | $40,000 | $112,640 |
| 2018 | $3,611 | $143,260 | $40,000 | $103,260 |
| 2017 | $3,356 | $130,508 | $40,000 | $90,508 |
| 2016 | $3,187 | $122,508 | $32,000 | $90,508 |
| 2015 | $3,108 | $118,508 | $28,000 | $90,508 |
| 2014 | $2,666 | $104,136 | $0 | $0 |
Source: Public Records
Map
Nearby Homes
- 1250 Rosewood Dr
- 3055 Rocky Brook Dr
- 2005 Brook Meadow Dr
- 2255 Rose Walk Dr
- St. Ives Plan at The Parc at Caney
- Heritage Manor Plan at The Parc at Caney
- Turnberry Park Plan at The Parc at Caney
- Chatham Place Plan at The Parc at Caney
- 3070 Brookwater Dr
- 2305 Park Walke Dr
- 250 Rose Meadow Ln
- 3030 Brookwater Dr Unit 1
- 2855 Strathmore Dr
- 3180 Caney Creek Ln
- 2875 Caney Rd
- 2710 Saddlebrook Glen Dr
- 910 Garden Reserve Ln
- 5370 McGinnis Ferry Rd
- 3250 Caney Estates Place
- 1630 Shadow Brook Way
- 1735 Stoney Brook Way
- 1610 Shadow Brook Way
- 1725 Stoney Brook Way
- 1725 Stoney Brook Way
- 1625 Shadow Brook Way
- 1715 Stoney Brook Way
- 1615 Shadow Brook Way
- 1600 Shadow Brook Way
- 1865 Valley Brook Dr Unit 8
- 1835 Valley Brook Dr
- 1705 Stoney Brook Way
- 0 Valley Brook Dr Unit 7454471
- 0 Valley Brook Dr Unit 7344581
- 0 Valley Brook Dr Unit 8139288
- 0 Valley Brook Dr Unit 7326384
- 1230 Rosewood Dr
- 1720 Stoney Brook Way
- 1730 Stoney Brook Way
- 1240 Rosewood Dr