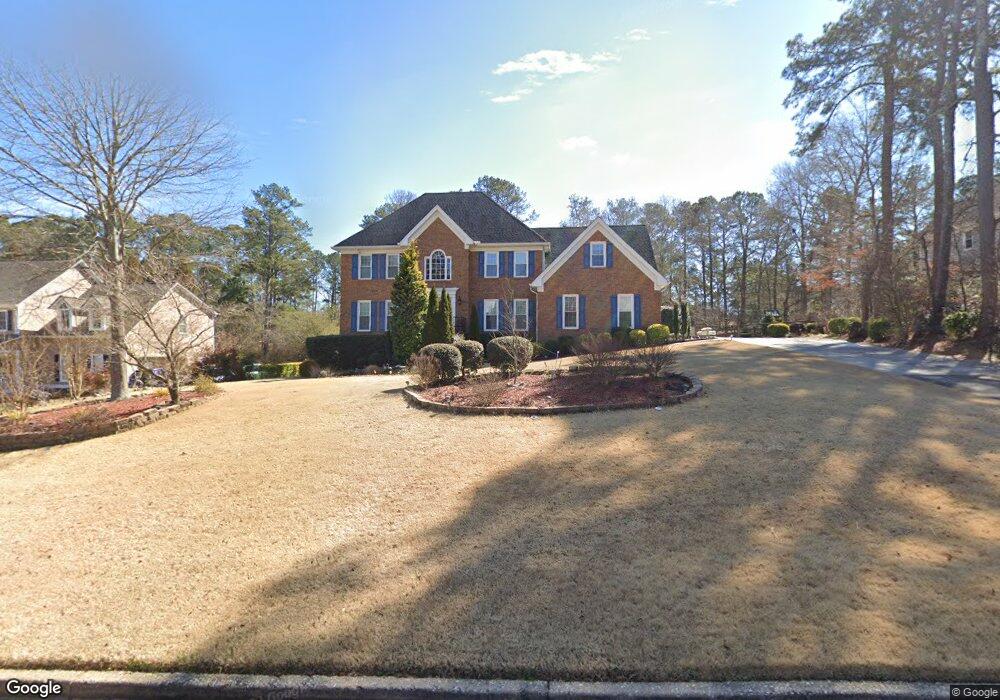
1620 Timberline Trace Unit 1 Snellville, GA 30078
Estimated Value: $426,130 - $575,000
4
Beds
4
Baths
3,129
Sq Ft
$160/Sq Ft
Est. Value
About This Home
This home is located at 1620 Timberline Trace Unit 1, Snellville, GA 30078 and is currently estimated at $500,783, approximately $160 per square foot. 1620 Timberline Trace Unit 1 is a home located in Gwinnett County with nearby schools including Magill Elementary School, Grace Snell Middle School, and South Gwinnett High School.
Ownership History
Date
Name
Owned For
Owner Type
Purchase Details
Closed on
May 22, 2020
Sold by
St Hillaire Merle D
Bought by
St Hillaire Merle D and St Hillaire Pierre
Current Estimated Value
Purchase Details
Closed on
May 30, 2006
Sold by
St Hillaire Merle D
Bought by
St Hillaire Pierre G and Nichols Euric
Home Financials for this Owner
Home Financials are based on the most recent Mortgage that was taken out on this home.
Original Mortgage
$190,000
Interest Rate
6.44%
Mortgage Type
New Conventional
Create a Home Valuation Report for This Property
The Home Valuation Report is an in-depth analysis detailing your home's value as well as a comparison with similar homes in the area
Home Values in the Area
Average Home Value in this Area
Purchase History
| Date | Buyer | Sale Price | Title Company |
|---|---|---|---|
| St Hillaire Merle D | -- | -- | |
| St Hillaire Pierre G | -- | -- | |
| Hillaire Merle D | $295,000 | -- |
Source: Public Records
Mortgage History
| Date | Status | Borrower | Loan Amount |
|---|---|---|---|
| Previous Owner | Hillaire Merle D | $190,000 |
Source: Public Records
Tax History Compared to Growth
Tax History
| Year | Tax Paid | Tax Assessment Tax Assessment Total Assessment is a certain percentage of the fair market value that is determined by local assessors to be the total taxable value of land and additions on the property. | Land | Improvement |
|---|---|---|---|---|
| 2024 | $4,533 | $178,240 | $32,120 | $146,120 |
| 2023 | $4,533 | $182,840 | $33,400 | $149,440 |
| 2022 | $4,298 | $166,000 | $24,000 | $142,000 |
| 2021 | $3,441 | $120,520 | $18,000 | $102,520 |
| 2020 | $4,059 | $120,520 | $18,000 | $102,520 |
| 2019 | $4,051 | $120,520 | $18,000 | $102,520 |
| 2018 | $4,069 | $120,520 | $18,000 | $102,520 |
| 2016 | $3,805 | $110,440 | $16,000 | $94,440 |
| 2015 | $3,342 | $92,440 | $16,000 | $76,440 |
| 2014 | $3,583 | $92,440 | $16,000 | $76,440 |
Source: Public Records
Map
Nearby Homes
- 3031 Alta Ridge Way
- 1415 Summit Chase Dr SW
- 1814 Emerson Lake Cir
- 1535 Summit Pond Cir Unit 8
- 2979 Overwood Ln
- 2880 Creekwood Dr
- 1292 Green Turf Dr
- 1797 Emerson Lake Cir
- 2984 Gayle Manor Ln
- The Daphne A Plan at Kelly Preserve
- The Dawson C Plan at Kelly Preserve
- The Glenwood D Plan at Kelly Preserve
- The Edison C Plan at Kelly Preserve
- 1902 Commons View Cir
- 1762 Juniper Berry Way
- 1610 Savoy Way
- 1693 Juniper Berry Way
- 1692 Juniper Berry Way
- 1610 Timberline Trace Unit 19
- 1610 Timberline Trace
- 1630 Timberline Trace Unit 1
- 2990 Vail Valley Ct Unit 12
- 2990 Vail Valley Ct
- 1640 Timberline Trace Unit 1
- 1600 Timberline Trace Unit 1
- 1605 Timberline Trace
- 1645 Timberline Trace
- 0 Timberline Trace Unit 8687990
- 0 Timberline Trace Unit 7252782
- 0 Timberline Trace Unit 7604328
- 0 Timberline Trace Unit 7273705
- 0 Timberline Trace Unit 7175230
- 0 Timberline Trace Unit 7080235
- 0 Timberline Trace Unit 7027042
- 0 Timberline Trace Unit 9007151
- 0 Timberline Trace Unit 8935772
- 0 Timberline Trace Unit 3130821
- 0 Timberline Trace Unit 3133600