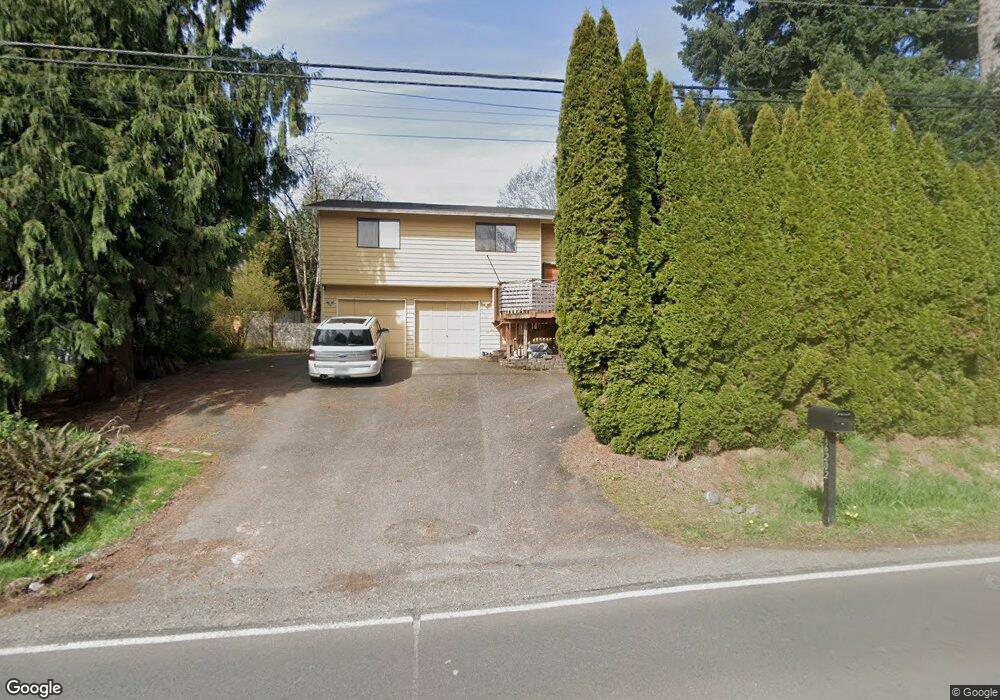
16202 Cascadian Way Bothell, WA 98012
Estimated Value: $739,000 - $807,000
3
Beds
3
Baths
2,072
Sq Ft
$366/Sq Ft
Est. Value
About This Home
This home is located at 16202 Cascadian Way, Bothell, WA 98012 and is currently estimated at $757,524, approximately $365 per square foot. 16202 Cascadian Way is a home located in Snohomish County with nearby schools including Oak Heights Elementary School, Alderwood Middle School, and Lynnwood High School.
Ownership History
Date
Name
Owned For
Owner Type
Purchase Details
Closed on
Oct 18, 2007
Sold by
Sitomer Laura A
Bought by
Lipana Joaquin and Lipana Anne
Current Estimated Value
Home Financials for this Owner
Home Financials are based on the most recent Mortgage that was taken out on this home.
Original Mortgage
$239,196
Outstanding Balance
$150,966
Interest Rate
6.42%
Mortgage Type
Purchase Money Mortgage
Estimated Equity
$606,558
Purchase Details
Closed on
Dec 8, 2003
Sold by
Hoffman Glenn R
Bought by
Sitomer Laura A
Purchase Details
Closed on
Mar 16, 1999
Sold by
Hastler Dean M
Bought by
Sitomer Laura A and Hoffman Glenn R
Home Financials for this Owner
Home Financials are based on the most recent Mortgage that was taken out on this home.
Original Mortgage
$65,000
Interest Rate
6.73%
Purchase Details
Closed on
Dec 31, 1998
Sold by
Hastler Amber Lee
Bought by
Hastler Dean Mitchell
Create a Home Valuation Report for This Property
The Home Valuation Report is an in-depth analysis detailing your home's value as well as a comparison with similar homes in the area
Home Values in the Area
Average Home Value in this Area
Purchase History
| Date | Buyer | Sale Price | Title Company |
|---|---|---|---|
| Lipana Joaquin | $288,628 | Old Republic Title Ltd | |
| Sitomer Laura A | -- | -- | |
| Sitomer Laura A | $206,500 | -- | |
| Hastler Dean Mitchell | -- | -- |
Source: Public Records
Mortgage History
| Date | Status | Borrower | Loan Amount |
|---|---|---|---|
| Open | Lipana Joaquin | $239,196 | |
| Previous Owner | Sitomer Laura A | $65,000 |
Source: Public Records
Tax History Compared to Growth
Tax History
| Year | Tax Paid | Tax Assessment Tax Assessment Total Assessment is a certain percentage of the fair market value that is determined by local assessors to be the total taxable value of land and additions on the property. | Land | Improvement |
|---|---|---|---|---|
| 2025 | $5,217 | $648,900 | $405,900 | $243,000 |
| 2024 | $5,217 | $623,800 | $388,500 | $235,300 |
| 2023 | $5,571 | $698,000 | $436,500 | $261,500 |
| 2022 | $5,143 | $524,100 | $301,200 | $222,900 |
| 2020 | $4,895 | $441,800 | $248,000 | $193,800 |
| 2019 | $4,473 | $401,200 | $213,800 | $187,400 |
| 2018 | $4,597 | $363,700 | $192,400 | $171,300 |
| 2017 | $3,787 | $309,200 | $149,600 | $159,600 |
| 2016 | $3,494 | $285,900 | $130,000 | $155,900 |
| 2015 | $3,524 | $274,200 | $124,000 | $150,200 |
| 2013 | $3,004 | $221,100 | $103,500 | $117,600 |
Source: Public Records
Map
Nearby Homes
- 14 160th Place SE
- 18 160th Place SE
- 11 160th Place SE
- 16225 1st Place W Unit 16
- 107 164th St SE Unit 2-301
- 16314 2nd Dr SE
- 15826 Meridian Ave S
- 16408 2nd Ave SE
- 16230 3rd Ave SE Unit A1
- 9 166th Place SE
- 8 157th Place SE
- 210 156th Place SW Unit MG 03
- 16504 3rd Dr SE
- Plan 2330 at Milagro - Milagro II
- Plan 2665 at Milagro - Milagro II
- Plan 2473 at Milagro - Milagro II
- Plan 1907 at Milagro - Milagro II
- Plan 2200 at Milagro - Milagro II
- Plan 2703 at Milagro - Milagro II
- 15606 Cascadian Way
- 16126 Cascadian Way
- 16216 Cascadian Way
- 16124 Cascadian Way Unit C8
- 16124 Cascadian Way Unit C6
- 16124 Cascadian Way Unit C5
- 16124 Cascadian Way Unit C4
- 16124 Cascadian Way Unit C3
- 16124 Cascadian Way Unit B5
- 16124 Cascadian Way Unit C2
- 16124 Cascadian Way Unit C1
- 16124 Cascadian Way Unit B7
- 16124 Cascadian Way Unit B6
- 16124 Cascadian Way Unit B1
- 16124 Cascadian Way Unit B4
- 16124 Cascadian Way Unit B3
- 16124 Cascadian Way Unit B2
- 16124 Cascadian Way Unit A7
- 16124 Cascadian Way Unit A5
- 16124 Cascadian Way Unit A6
- 16124 Cascadian Way Unit A3