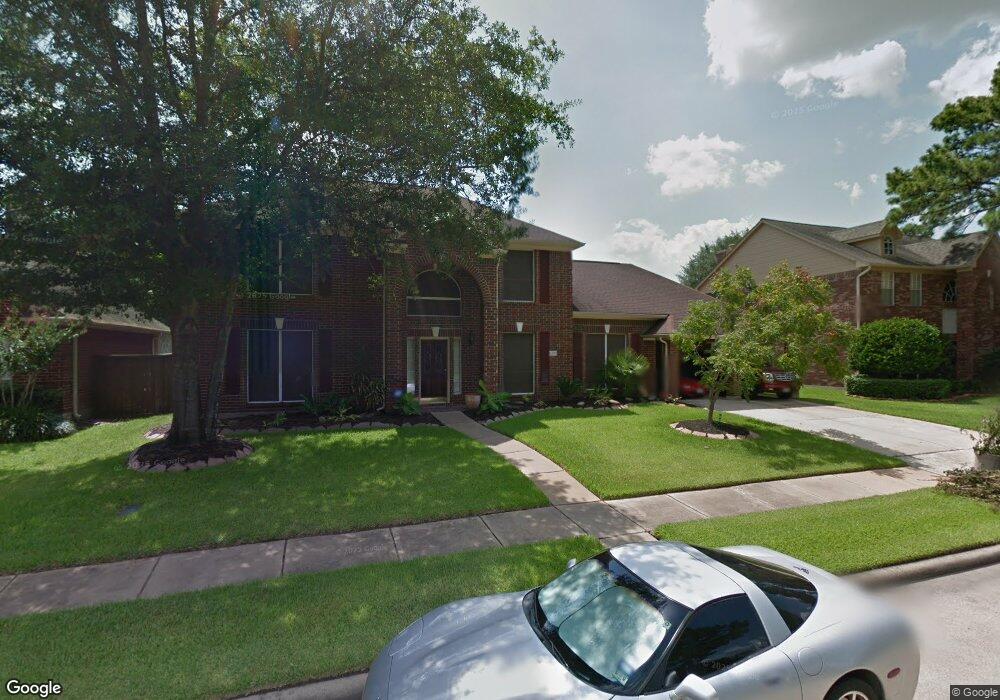
16206 Willowpark Dr Tomball, TX 77377
Estimated Value: $362,000 - $409,000
4
Beds
3
Baths
2,979
Sq Ft
$131/Sq Ft
Est. Value
About This Home
This home is located at 16206 Willowpark Dr, Tomball, TX 77377 and is currently estimated at $390,901, approximately $131 per square foot. 16206 Willowpark Dr is a home located in Harris County with nearby schools including Lakewood Elementary School, Willow Wood Junior High School, and Northpointe Intermediate School.
Ownership History
Date
Name
Owned For
Owner Type
Purchase Details
Closed on
Dec 27, 2002
Sold by
Choice Homes Inc
Bought by
Trinh Truong
Current Estimated Value
Home Financials for this Owner
Home Financials are based on the most recent Mortgage that was taken out on this home.
Original Mortgage
$80,000
Interest Rate
5.96%
Purchase Details
Closed on
Jun 27, 1997
Sold by
Value Investments & Properties Inc
Bought by
Offer Robert F and Offer Darlene Suarez
Home Financials for this Owner
Home Financials are based on the most recent Mortgage that was taken out on this home.
Original Mortgage
$146,700
Interest Rate
7.93%
Mortgage Type
VA
Purchase Details
Closed on
Aug 30, 1994
Sold by
Pacific Environmental & Development Corp
Bought by
Value Investments & Properties Inc
Create a Home Valuation Report for This Property
The Home Valuation Report is an in-depth analysis detailing your home's value as well as a comparison with similar homes in the area
Home Values in the Area
Average Home Value in this Area
Purchase History
| Date | Buyer | Sale Price | Title Company |
|---|---|---|---|
| Trinh Truong | -- | Charter Title Company | |
| Offer Robert F | -- | Fidelity National Title | |
| Value Investments & Properties Inc | -- | -- |
Source: Public Records
Mortgage History
| Date | Status | Borrower | Loan Amount |
|---|---|---|---|
| Closed | Trinh Truong | $80,000 | |
| Previous Owner | Offer Robert F | $146,700 |
Source: Public Records
Tax History Compared to Growth
Tax History
| Year | Tax Paid | Tax Assessment Tax Assessment Total Assessment is a certain percentage of the fair market value that is determined by local assessors to be the total taxable value of land and additions on the property. | Land | Improvement |
|---|---|---|---|---|
| 2025 | -- | $382,623 | $63,842 | $318,781 |
| 2024 | -- | $391,552 | $63,842 | $327,710 |
| 2023 | $7,085 | $396,490 | $63,842 | $332,648 |
| 2022 | $6,930 | $344,878 | $53,150 | $291,728 |
| 2021 | $6,582 | $270,577 | $37,739 | $232,838 |
| 2020 | $6,340 | $251,477 | $37,739 | $213,738 |
| 2019 | $6,423 | $247,147 | $29,563 | $217,584 |
| 2018 | $1,953 | $247,147 | $29,563 | $217,584 |
| 2017 | $12,825 | $247,147 | $29,563 | $217,584 |
| 2016 | $6,377 | $247,147 | $29,563 | $217,584 |
| 2015 | $2,785 | $247,147 | $29,563 | $217,584 |
| 2014 | $2,785 | $210,222 | $29,563 | $180,659 |
Source: Public Records
Map
Nearby Homes
- 12319 Hamsfield Ct
- 12411 Exbury Ct
- 16218 Jordyn Lake Dr
- 16107 Sweetwater Fields Ln Unit B1
- 16610 Avenfield Rd
- 12502 Pavilion Ct
- 16106 Limestone Lake Dr
- 16030 Summerville Lake Dr
- 16012 Summerville Lake Dr
- 12515 Pavilion Ct
- 12209 Medina Lake Dr
- 12407 Wealdstone Dr
- 15843 Collinsville Dr
- 12502 Wealdstone Dr
- 12422 Hammersmith Dr
- 15975 W Bellefontaine Way
- 15826 Collinsville Dr
- 16855 E Maglitto Cir
- 16723 Chewton Glen St
- 11814 Lake Grove Ct
- 16210 Willowpark Dr
- 16202 Willowpark Dr
- 16207 Avenplace Rd
- 16211 Avenplace Rd
- 16203 Avenplace Rd
- 16207 Willowpark Dr
- 16214 Willowpark Dr
- 16211 Willowpark Dr
- 16203 Willowpark Dr
- 16215 Avenplace Rd
- 16215 Willowpark Dr
- 12303 Guernsey Dr
- 12307 Guernsey Dr
- 16218 Willowpark Dr
- 16206 Lakestone Dr
- 16219 Avenplace Rd
- 12311 Guernsey Dr
- 16206 Avenplace Rd
- 16210 Lakestone Dr
- 16131 Willowpark Dr