Estimated Value: $592,000 - $609,000
4
Beds
3
Baths
2,560
Sq Ft
$235/Sq Ft
Est. Value
About This Home
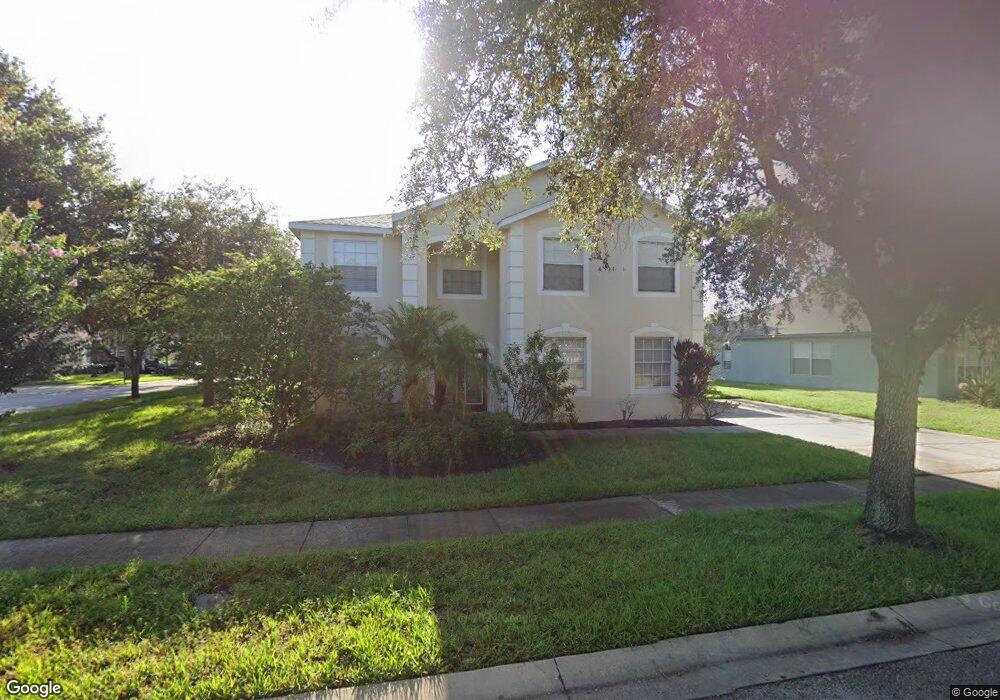
This home is located at 16207 Leta Trace Ct, Tampa, FL 33624 and is currently estimated at $602,396, approximately $235 per square foot. 16207 Leta Trace Ct is a home located in Hillsborough County with nearby schools including Northwest Elementary School, Hill Middle School, and Steinbrenner High School.
Ownership History
Date
Name
Owned For
Owner Type
Purchase Details
Closed on
Dec 18, 2015
Sold by
Young John R and Young Linda J Z
Bought by
Young John R and Young Linda J Z
Current Estimated Value
Purchase Details
Closed on
May 1, 2015
Sold by
Tromp Felix and Tromp Johanna A
Bought by
Young John R and Zhou Linda J
Home Financials for this Owner
Home Financials are based on the most recent Mortgage that was taken out on this home.
Original Mortgage
$283,500
Outstanding Balance
$219,893
Interest Rate
3.87%
Mortgage Type
New Conventional
Estimated Equity
$382,503
Purchase Details
Closed on
Oct 30, 2002
Sold by
Beazer Homes Corp
Bought by
Tromp Felix and Tromp Johanna A
Home Financials for this Owner
Home Financials are based on the most recent Mortgage that was taken out on this home.
Original Mortgage
$195,600
Interest Rate
6.01%
Mortgage Type
New Conventional
Create a Home Valuation Report for This Property
The Home Valuation Report is an in-depth analysis detailing your home's value as well as a comparison with similar homes in the area
Home Values in the Area
Average Home Value in this Area
Purchase History
| Date | Buyer | Sale Price | Title Company |
|---|---|---|---|
| Young John R | -- | Attorney | |
| Young John R | $315,000 | Tampa Title Company | |
| Tromp Felix | $244,600 | -- |
Source: Public Records
Mortgage History
| Date | Status | Borrower | Loan Amount |
|---|---|---|---|
| Open | Young John R | $283,500 | |
| Previous Owner | Tromp Felix | $203,564 | |
| Previous Owner | Tromp Felix | $195,943 | |
| Previous Owner | Tromp Felix | $195,600 |
Source: Public Records
Tax History Compared to Growth
Tax History
| Year | Tax Paid | Tax Assessment Tax Assessment Total Assessment is a certain percentage of the fair market value that is determined by local assessors to be the total taxable value of land and additions on the property. | Land | Improvement |
|---|---|---|---|---|
| 2024 | $4,882 | $264,669 | -- | -- |
| 2023 | $4,720 | $256,960 | $0 | $0 |
| 2022 | $4,779 | $249,476 | $0 | $0 |
| 2021 | $4,533 | $242,210 | $0 | $0 |
| 2020 | $4,439 | $238,866 | $0 | $0 |
| 2019 | $4,324 | $233,496 | $0 | $0 |
| 2018 | $4,268 | $229,142 | $0 | $0 |
| 2017 | $4,216 | $234,035 | $0 | $0 |
| 2016 | $4,153 | $219,813 | $0 | $0 |
| 2015 | $3,420 | $214,280 | $0 | $0 |
| 2014 | $3,394 | $177,068 | $0 | $0 |
| 2013 | -- | $174,451 | $0 | $0 |
Source: Public Records
Map
Nearby Homes
- 5622 Glencrest Blvd
- 0 Wilcox Rd Unit W7849727
- 16502 Cayman Dr
- 16405 Lucia Gardens Ln
- 5303 Redfield Ln
- 16409 Lucia Gardens Ln
- 5707 Camila Song Ln
- 16213 Dew Drop Ln
- 16201 Country Crossing Dr
- 5817 Myrtle Ln
- 15911 Ironware Place
- 16214 Pebblebrook Dr
- 16637 Ashton Green Dr
- 16032 Eagle River Way
- 4915 Pennsbury Dr
- 5138 Lakecastle Dr
- 15909 Crying Wind Dr
- 16526 Ballyshannon Dr
- 15612 Howell Park Ln
- 15903 Mystic Way
- 16205 Leta Trace Ct
- 5524 Lake Leta Blvd
- 5525 Lake Leta Blvd
- 16203 Leta Trace Ct
- 5527 Lake Leta Blvd
- 16208 Leta Trace Ct
- 5522 Lake Leta Blvd
- 5523 Lake Leta Blvd
- 16206 Leta Trace Ct
- 5529 Lake Leta Blvd
- 5521 Lake Leta Blvd
- 16204 Leta Trace Ct
- 5531 Lake Leta Blvd
- 16201 Leta Trace Ct
- 5512 Lake Leta Blvd
- 5510 Lake Leta Blvd
- 5508 Lake Leta Blvd
- 16202 Leta Trace Ct
- 5506 Lake Leta Blvd