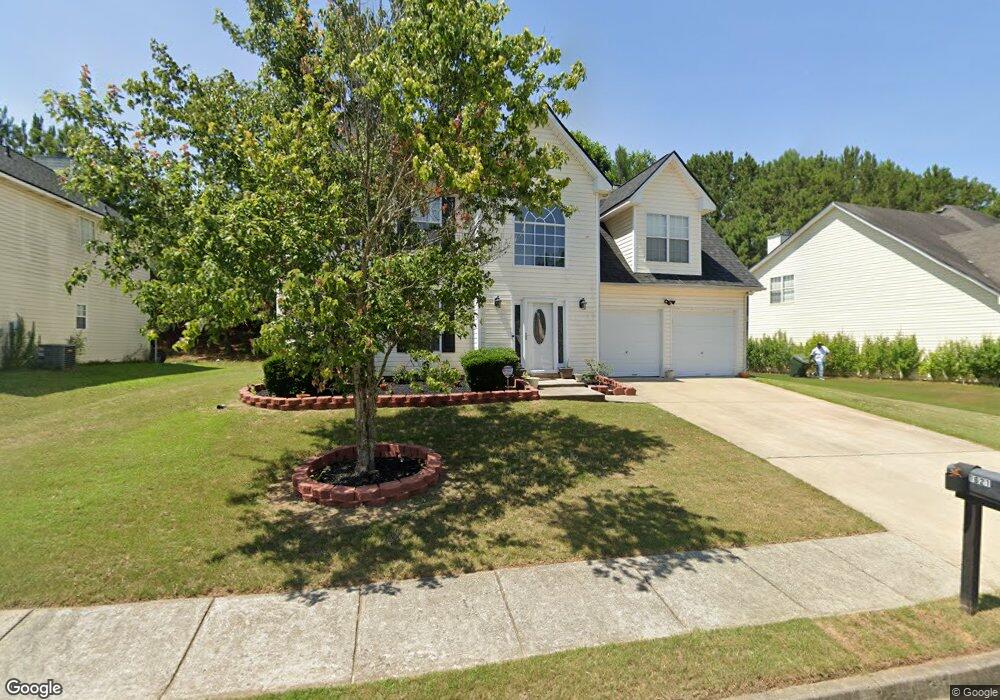
1621 Callaway Loop Conyers, GA 30012
Estimated Value: $236,000 - $300,000
4
Beds
3
Baths
2,010
Sq Ft
$136/Sq Ft
Est. Value
About This Home
This home is located at 1621 Callaway Loop, Conyers, GA 30012 and is currently estimated at $274,263, approximately $136 per square foot. 1621 Callaway Loop is a home located in Rockdale County with nearby schools including Pine Street Elementary School, Conyers Middle School, and Rockdale County High School.
Ownership History
Date
Name
Owned For
Owner Type
Purchase Details
Closed on
Jan 5, 2021
Sold by
Humes Dorla Evadne
Bought by
Williams Lisa Y
Current Estimated Value
Home Financials for this Owner
Home Financials are based on the most recent Mortgage that was taken out on this home.
Original Mortgage
$142,500
Outstanding Balance
$126,305
Interest Rate
2.71%
Mortgage Type
New Conventional
Estimated Equity
$147,958
Purchase Details
Closed on
Feb 24, 2006
Sold by
Ferguson Milton
Bought by
Humes Dorla E and Downes Everton
Home Financials for this Owner
Home Financials are based on the most recent Mortgage that was taken out on this home.
Original Mortgage
$122,400
Interest Rate
6.05%
Mortgage Type
New Conventional
Purchase Details
Closed on
Jan 14, 2003
Sold by
Creekwood Hms Inc
Bought by
Ferguson Milton
Home Financials for this Owner
Home Financials are based on the most recent Mortgage that was taken out on this home.
Original Mortgage
$129,871
Interest Rate
5.95%
Mortgage Type
VA
Create a Home Valuation Report for This Property
The Home Valuation Report is an in-depth analysis detailing your home's value as well as a comparison with similar homes in the area
Home Values in the Area
Average Home Value in this Area
Purchase History
| Date | Buyer | Sale Price | Title Company |
|---|---|---|---|
| Williams Lisa Y | $150,000 | -- | |
| Humes Dorla E | $144,000 | -- | |
| Ferguson Milton | $132,000 | -- |
Source: Public Records
Mortgage History
| Date | Status | Borrower | Loan Amount |
|---|---|---|---|
| Open | Williams Lisa Y | $142,500 | |
| Previous Owner | Humes Dorla E | $122,400 | |
| Previous Owner | Ferguson Milton | $129,871 |
Source: Public Records
Tax History
| Year | Tax Paid | Tax Assessment Tax Assessment Total Assessment is a certain percentage of the fair market value that is determined by local assessors to be the total taxable value of land and additions on the property. | Land | Improvement |
|---|---|---|---|---|
| 2025 | $4,380 | $122,720 | $22,960 | $99,760 |
| 2024 | $4,256 | $111,600 | $23,760 | $87,840 |
| 2023 | $3,125 | $84,640 | $21,680 | $62,960 |
| 2022 | $2,151 | $66,840 | $15,080 | $51,760 |
| 2021 | $1,259 | $37,120 | $6,000 | $31,120 |
| 2020 | $1,321 | $37,120 | $6,000 | $31,120 |
| 2019 | $1,345 | $37,120 | $6,000 | $31,120 |
| 2018 | $685 | $37,120 | $6,000 | $31,120 |
| 2017 | $1,107 | $34,280 | $6,000 | $28,280 |
| 2016 | $1,067 | $34,280 | $6,000 | $28,280 |
| 2015 | $560 | $34,280 | $6,000 | $28,280 |
| 2014 | $503 | $34,280 | $6,000 | $28,280 |
| 2013 | -- | $31,480 | $7,200 | $24,280 |
Source: Public Records
Map
Nearby Homes
- 401 Overlook
- 1544 Callaway Loop
- 119 Odyssey Turn
- 1971 Wilson Rd NW
- 1490 Broad St NE
- 168 Odyssey Turn
- 1956 Highway 20 NE
- 0 Yarbrough Rd NE
- 2062 Wilson Rd NW
- 174 Ellis Dr
- 0 Milstead Ave NE Unit 10714534
- 0 Milstead Ave NE Unit 7738524
- 125 Ellis Dr
- 1617 Elm St NE
- 109 Ellis Dr
- 1744 Sigman East Dr NW Unit 1
- 1698 Stag Ct NW
- 1645 Main St NE
- 1666 NE East Brook Dr
- 1729 Spring St NE
- 1611 Callaway Loop Unit 113
- 1611 Callaway Loop
- 1631 Callaway Loop
- 351 Overlook Turn
- 341 Overlook Turn
- 1601 Callaway Loop
- 1620 Callaway Loop
- 361 Overlook Turn
- 1641 Callaway Loop
- 1630 Callaway Loop
- 331 Overlook Turn
- 1610 Callaway Loop
- 1640 Callaway Loop
- 371 Overlook Turn
- 1600 Callaway Loop Unit 29
- 1600 Callaway Loop
- 1591 Callaway Loop
- 1651 Callaway Loop
- 321 Overlook Turn
- 1650 Callaway Loop
Your Personal Tour Guide
Ask me questions while you tour the home.