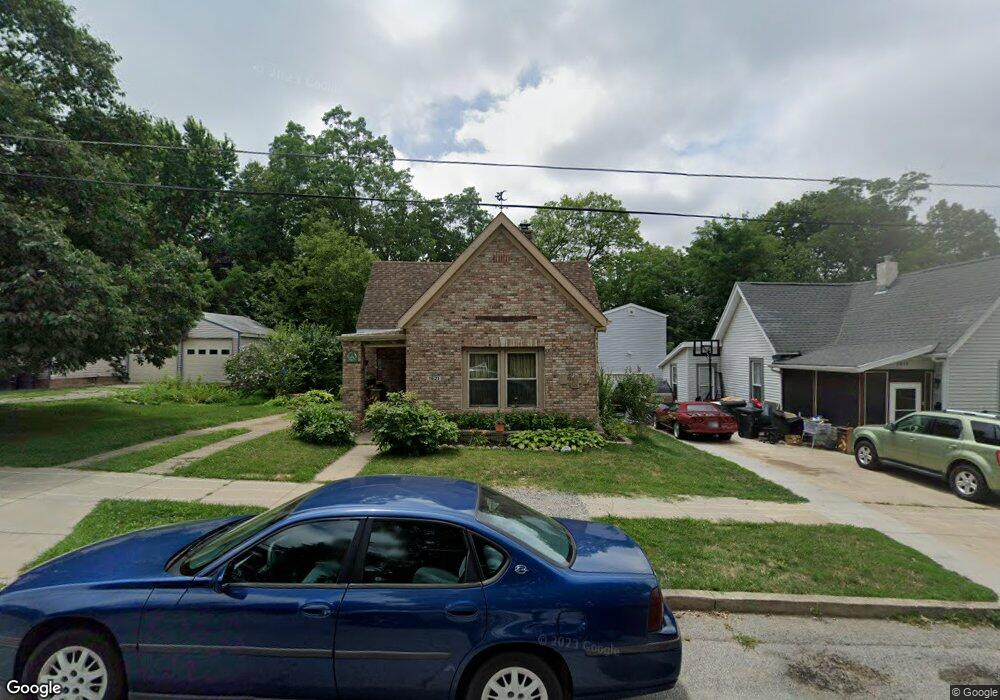
1621 Cason St Lafayette, IN 47904
Perrin NeighborhoodEstimated Value: $148,000 - $188,000
Studio
--
Bath
885
Sq Ft
$188/Sq Ft
Est. Value
About This Home
This home is located at 1621 Cason St, Lafayette, IN 47904 and is currently estimated at $166,181, approximately $187 per square foot. 1621 Cason St is a home located in Tippecanoe County with nearby schools including Murdock Elementary School, Sunnyside Intermediate School, and Lafayette Tecumseh Junior High School.
Ownership History
Date
Name
Owned For
Owner Type
Purchase Details
Closed on
Apr 29, 2005
Sold by
Zimmerman David R and Zimmerman Linda S
Bought by
Waymire Joseph B
Current Estimated Value
Home Financials for this Owner
Home Financials are based on the most recent Mortgage that was taken out on this home.
Original Mortgage
$69,201
Outstanding Balance
$35,570
Interest Rate
5.62%
Mortgage Type
Fannie Mae Freddie Mac
Estimated Equity
$130,611
Create a Home Valuation Report for This Property
The Home Valuation Report is an in-depth analysis detailing your home's value as well as a comparison with similar homes in the area
Home Values in the Area
Average Home Value in this Area
Purchase History
| Date | Buyer | Sale Price | Title Company |
|---|---|---|---|
| Waymire Joseph B | -- | Poelstra Title Company |
Source: Public Records
Mortgage History
| Date | Status | Borrower | Loan Amount |
|---|---|---|---|
| Open | Waymire Joseph B | $69,201 |
Source: Public Records
Tax History
| Year | Tax Paid | Tax Assessment Tax Assessment Total Assessment is a certain percentage of the fair market value that is determined by local assessors to be the total taxable value of land and additions on the property. | Land | Improvement |
|---|---|---|---|---|
| 2024 | $689 | $101,500 | $16,000 | $85,500 |
| 2023 | $619 | $95,600 | $16,000 | $79,600 |
| 2022 | $455 | $79,400 | $16,000 | $63,400 |
| 2021 | $358 | $67,200 | $16,000 | $51,200 |
| 2020 | $329 | $64,100 | $16,000 | $48,100 |
| 2019 | $313 | $61,900 | $16,000 | $45,900 |
| 2018 | $303 | $59,800 | $16,000 | $43,800 |
| 2017 | $291 | $58,400 | $16,000 | $42,400 |
| 2016 | $274 | $56,700 | $16,000 | $40,700 |
| 2014 | $248 | $54,100 | $16,000 | $38,100 |
| 2013 | $240 | $53,300 | $16,000 | $37,300 |
Source: Public Records
Map
Nearby Homes
Your Personal Tour Guide
Ask me questions while you tour the home.