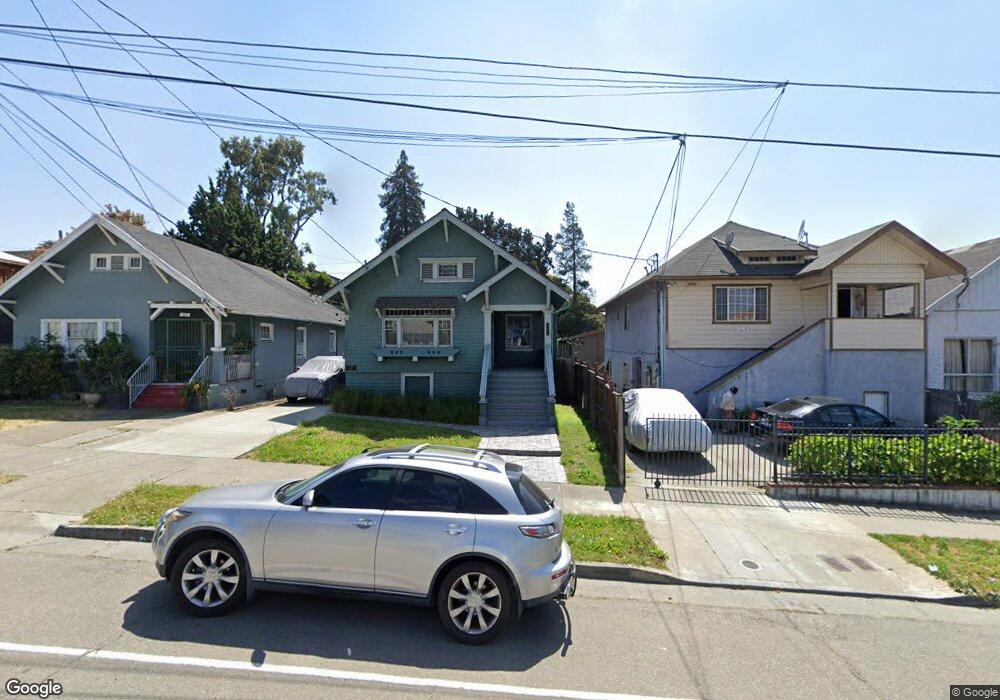
1621 E 21st St Oakland, CA 94606
San Antonio NeighborhoodEstimated Value: $545,000 - $615,000
3
Beds
2
Baths
1,502
Sq Ft
$386/Sq Ft
Est. Value
About This Home
This home is located at 1621 E 21st St, Oakland, CA 94606 and is currently estimated at $580,000, approximately $386 per square foot. 1621 E 21st St is a home located in Alameda County with nearby schools including Garfield Elementary School, Roosevelt Middle School, and Oakland High School.
Ownership History
Date
Name
Owned For
Owner Type
Purchase Details
Closed on
Jul 10, 1998
Sold by
Poole Kenneth and Poole Josette
Bought by
Poole Kenneth M
Current Estimated Value
Home Financials for this Owner
Home Financials are based on the most recent Mortgage that was taken out on this home.
Original Mortgage
$65,000
Interest Rate
7.01%
Mortgage Type
Commercial
Create a Home Valuation Report for This Property
The Home Valuation Report is an in-depth analysis detailing your home's value as well as a comparison with similar homes in the area
Home Values in the Area
Average Home Value in this Area
Purchase History
We collect this data history from publicly available records. To have your information removed, we recommend requesting removal directly through your county’s website.
| Date | Buyer | Sale Price | Title Company |
|---|---|---|---|
| Poole Kenneth M | -- | -- |
Source: Public Records
Mortgage History
We collect this data history from publicly available records. To have your information removed, we recommend requesting removal directly through your county’s website.
| Date | Status | Borrower | Loan Amount |
|---|---|---|---|
| Previous Owner | Poole Kenneth M | $65,000 |
Source: Public Records
Tax History
| Year | Tax Paid | Tax Assessment Tax Assessment Total Assessment is a certain percentage of the fair market value that is determined by local assessors to be the total taxable value of land and additions on the property. | Land | Improvement |
|---|---|---|---|---|
| 2025 | $4,281 | $148,373 | $44,172 | $104,201 |
| 2024 | $4,281 | $145,464 | $43,306 | $102,158 |
| 2023 | $4,329 | $142,612 | $42,457 | $100,155 |
| 2022 | $4,072 | $139,817 | $41,625 | $98,192 |
| 2021 | $3,683 | $137,076 | $40,809 | $96,267 |
| 2020 | $3,637 | $135,670 | $40,390 | $95,280 |
| 2019 | $3,367 | $133,010 | $39,598 | $93,412 |
| 2018 | $3,296 | $130,403 | $38,822 | $91,581 |
| 2017 | $3,117 | $127,846 | $38,061 | $89,785 |
| 2016 | $2,935 | $125,340 | $37,315 | $88,025 |
| 2015 | $2,913 | $123,457 | $36,754 | $86,703 |
| 2014 | $2,969 | $121,039 | $36,034 | $85,005 |
Source: Public Records
Map
Nearby Homes
- 2006 14th Ave
- 2141 14th Ave
- 1747 E 22nd St
- 2212 17th Ave
- 1744 E 22nd St
- 2226 13th Ave
- 1829 E 22nd St
- 2138 19th Ave
- 1944 E 20th St
- 1946 E 20th St
- 1140 E 22nd St
- 1737 13th Ave
- 1357 E 25th St
- 2301 12th Ave
- 2036 E 20th St
- 1328 E 25th St
- 2038 2040 Lakeshore
- 1533 14th Ave
- 2120 E 22nd St
- 1515 14th Ave Unit 305
Your Personal Tour Guide
Ask me questions while you tour the home.