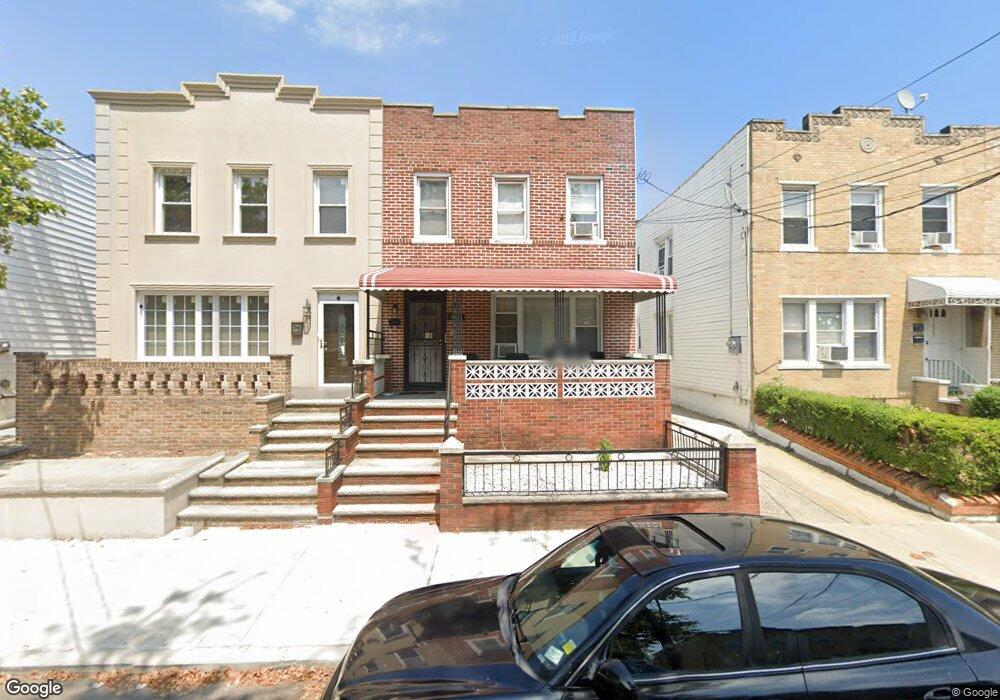
1621 E 32nd St Brooklyn, NY 11234
Marine Park NeighborhoodEstimated Value: $813,000 - $1,061,000
Studio
--
Bath
1,600
Sq Ft
$589/Sq Ft
Est. Value
About This Home
This home is located at 1621 E 32nd St, Brooklyn, NY 11234 and is currently estimated at $941,649, approximately $588 per square foot. 1621 E 32nd St is a home located in Kings County with nearby schools including PS 222 Katherine R Snyder, J.H.S. 278 Marine Park, and James Madison High School.
Ownership History
Date
Name
Owned For
Owner Type
Purchase Details
Closed on
Dec 15, 2021
Sold by
Afs Revocable Trust and Schachner Trustee Abraham
Bought by
Schachner Joshua
Current Estimated Value
Purchase Details
Closed on
Feb 18, 2021
Sold by
Schachner Faige
Bought by
Abraham Schachner As Trustee and Afs Revocable Trust
Purchase Details
Closed on
Aug 28, 2014
Sold by
Zach Vitaly and Zach Marina
Bought by
Schachner Faige and Schachner Joshua
Home Financials for this Owner
Home Financials are based on the most recent Mortgage that was taken out on this home.
Original Mortgage
$400,000
Interest Rate
4.11%
Mortgage Type
New Conventional
Purchase Details
Closed on
Apr 24, 1998
Sold by
Zachinyayev Vitaly
Bought by
Zach Vitaly and Zach Marina
Home Financials for this Owner
Home Financials are based on the most recent Mortgage that was taken out on this home.
Original Mortgage
$4,723
Interest Rate
6.98%
Create a Home Valuation Report for This Property
The Home Valuation Report is an in-depth analysis detailing your home's value as well as a comparison with similar homes in the area
Home Values in the Area
Average Home Value in this Area
Purchase History
| Date | Buyer | Sale Price | Title Company |
|---|---|---|---|
| Schachner Joshua | -- | -- | |
| Schachner Joshua | -- | -- | |
| Schachner Joshua | -- | -- | |
| Abraham Schachner As Trustee | -- | -- | |
| Abraham Schachner As Trustee | -- | -- | |
| Abraham Schachner As Trustee | -- | -- | |
| Schachner Faige | $635,000 | -- | |
| Schachner Faige | $635,000 | -- | |
| Zach Vitaly | -- | Trw Title Insurance | |
| Zach Vitaly | -- | Trw Title Insurance |
Source: Public Records
Mortgage History
| Date | Status | Borrower | Loan Amount |
|---|---|---|---|
| Previous Owner | Schachner Faige | $400,000 | |
| Previous Owner | Zach Vitaly | $4,723 | |
| Closed | Zach Vitaly | $4,723 |
Source: Public Records
Tax History
| Year | Tax Paid | Tax Assessment Tax Assessment Total Assessment is a certain percentage of the fair market value that is determined by local assessors to be the total taxable value of land and additions on the property. | Land | Improvement |
|---|---|---|---|---|
| 2025 | $7,836 | $54,300 | $11,160 | $43,140 |
| 2024 | $7,836 | $48,060 | $11,160 | $36,900 |
| 2023 | $7,681 | $57,600 | $11,160 | $46,440 |
| 2022 | $7,478 | $51,780 | $11,160 | $40,620 |
| 2021 | $7,141 | $51,060 | $11,160 | $39,900 |
| 2020 | $3,340 | $49,440 | $11,160 | $38,280 |
| 2019 | $6,508 | $47,700 | $11,160 | $36,540 |
| 2018 | $6,127 | $31,518 | $9,350 | $22,168 |
| 2017 | $6,064 | $31,216 | $8,318 | $22,898 |
| 2016 | $5,577 | $29,450 | $8,695 | $20,755 |
| 2015 | -- | $27,786 | $10,401 | $17,385 |
| 2014 | -- | $27,094 | $10,869 | $16,225 |
Source: Public Records
Map
Nearby Homes
- 1627 E 32nd St
- 1663 E 32nd St
- 1551 E 32nd St
- 3112 Quentin Rd
- 1664 E 35th St
- 2952 Avenue P
- 1736 E 33rd St
- 1659 Madison Place
- 1523 E 33rd St
- 1638 E 36th St
- 2991 Quentin Rd
- 2881 Nostrand Ave Unit 1C
- 1743 E 33rd St
- 1569 E 34th St
- 1664 Madison Place
- 1715 E 35th St
- 1544 E 34th St
- 2922 Nostrand Ave Unit 6A
- 1774 E 32nd St
- 3617 Quentin Rd
- 1625 E 32nd St Unit 2FL
- 1619 E 32nd St
- 1615 E 32nd St
- 1613 E 32nd St
- 1622 E 33rd St
- 1633 E 32nd St
- 1626 E 33rd St
- 1620 E 33rd St
- 1628 E 33rd St
- 1616 E 33rd St
- 1632 E 33rd St
- 1637 E 32nd St
- 1614 E 33rd St
- 3204 Avenue P
- 3210 Avenue P
- 1634 E 33rd St
- 3202 Avenue P
- 3212 Avenue P
- 1639 E 32nd St
- 3216 Avenue P
Your Personal Tour Guide
Ask me questions while you tour the home.