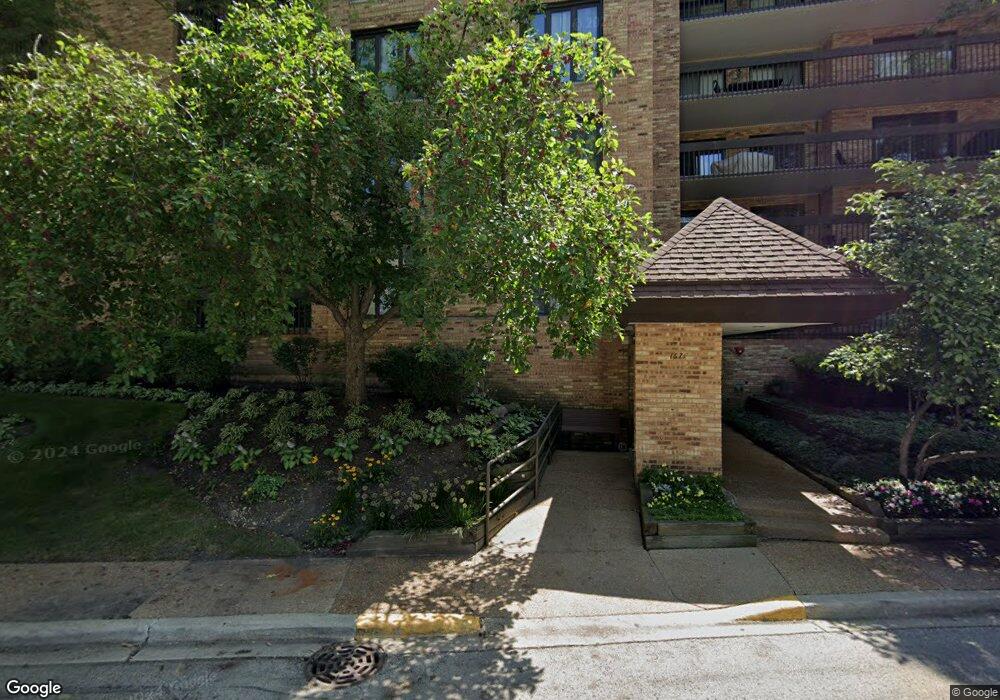
1621 Mission Hills Rd Unit N Northbrook, IL 60062
Estimated Value: $531,000 - $670,000
3
Beds
--
Bath
2,279
Sq Ft
$270/Sq Ft
Est. Value
About This Home
This home is located at 1621 Mission Hills Rd Unit N, Northbrook, IL 60062 and is currently estimated at $614,535, approximately $269 per square foot. 1621 Mission Hills Rd Unit N is a home located in Cook County with nearby schools including Henry Winkelman Elementary School, Field Middle School, and Glenbrook North High School.
Ownership History
Date
Name
Owned For
Owner Type
Purchase Details
Closed on
Sep 21, 2023
Sold by
Apex National Real Estate Llc
Bought by
Pirsch David M and Pirsch Susan T
Current Estimated Value
Purchase Details
Closed on
Sep 22, 2019
Sold by
Fox Leeta M
Bought by
Apex National Real Estate Llc
Home Financials for this Owner
Home Financials are based on the most recent Mortgage that was taken out on this home.
Original Mortgage
$328,922
Interest Rate
3.5%
Mortgage Type
Construction
Purchase Details
Closed on
Nov 7, 2006
Sold by
Gubin Robert
Bought by
Fox Nathan and Fox Leeta M
Purchase Details
Closed on
Mar 4, 1996
Sold by
Gubin Robert and Gubin Charlotte
Bought by
Robert & Charlotte Gubin Revocable Trust
Create a Home Valuation Report for This Property
The Home Valuation Report is an in-depth analysis detailing your home's value as well as a comparison with similar homes in the area
Home Values in the Area
Average Home Value in this Area
Purchase History
| Date | Buyer | Sale Price | Title Company |
|---|---|---|---|
| Pirsch David M | $550,000 | None Listed On Document | |
| Pirsch David M | $550,000 | None Listed On Document | |
| Apex National Real Estate Llc | $270,000 | First American Title | |
| Fox Nathan | $572,000 | St | |
| Robert & Charlotte Gubin Revocable Trust | -- | -- |
Source: Public Records
Mortgage History
| Date | Status | Borrower | Loan Amount |
|---|---|---|---|
| Previous Owner | Apex National Real Estate Llc | $328,922 |
Source: Public Records
Tax History Compared to Growth
Tax History
| Year | Tax Paid | Tax Assessment Tax Assessment Total Assessment is a certain percentage of the fair market value that is determined by local assessors to be the total taxable value of land and additions on the property. | Land | Improvement |
|---|---|---|---|---|
| 2024 | $5,454 | $33,029 | $622 | $32,407 |
| 2023 | $5,373 | $33,029 | $622 | $32,407 |
| 2022 | $5,373 | $33,029 | $622 | $32,407 |
| 2021 | $5,740 | $30,907 | $548 | $30,359 |
| 2020 | $5,551 | $30,907 | $548 | $30,359 |
| 2019 | $1,768 | $33,917 | $548 | $33,369 |
| 2018 | $1,938 | $28,459 | $438 | $28,021 |
| 2017 | $1,868 | $28,459 | $438 | $28,021 |
| 2016 | $5,584 | $28,459 | $438 | $28,021 |
| 2015 | $3,621 | $16,783 | $384 | $16,399 |
| 2014 | $2,527 | $16,783 | $384 | $16,399 |
| 2013 | $3,463 | $16,783 | $384 | $16,399 |
Source: Public Records
Map
Nearby Homes
- 1621 Mission Hills Rd Unit 104
- 1671 Mission Hills Rd Unit 302
- 1671 Mission Hills Rd Unit S
- 1671 Mission Hills Rd Unit 501
- 3801 Mission Hills Rd Unit 204
- 3801 Mission Hills Rd Unit 304
- 3851 Mission Hills Rd Unit 409
- 3801 Mission Hills Rd Unit 510
- 3810 Mission Hills Rd Unit 502
- 3899 Mission Hills Rd Unit 4
- 1696 Highland Ave
- 3741 Mission Hills Rd Unit 110
- 3741 Mission Hills Rd Unit 209
- 3955 Mission Hills Rd Unit D
- 3900 Mission Hills Rd Unit 407
- 3969 Maple Ave
- 3829 Eastwind Ct
- 4001 Walters Ave
- 8 The Court of Charlwood
- 12 The Court of Island Point
- 1621 Mission Hills Rd Unit 205
- 1621 Mission Hills Rd Unit 405
- 1621 Mission Hills Rd Unit 106
- 1621 Mission Hills Rd Unit N
- 1621 Mission Hills Rd Unit N
- 1621 Mission Hills Rd Unit N
- 1621 Mission Hills Rd Unit N
- 1621 Mission Hills Rd Unit N
- 1621 Mission Hills Rd Unit N
- 1621 Mission Hills Rd Unit N
- 1621 Mission Hills Rd Unit N
- 1621 Mission Hills Rd Unit N
- 1621 Mission Hills Rd Unit N
- 1621 Mission Hills Rd Unit N
- 1621 Mission Hills Rd Unit N
- 1621 Mission Hills Rd Unit N
- 1621 Mission Hills Rd Unit N
- 1621 Mission Hills Rd Unit N
- 1621 Mission Hills Rd Unit N
- 1621 Mission Hills Rd Unit N5