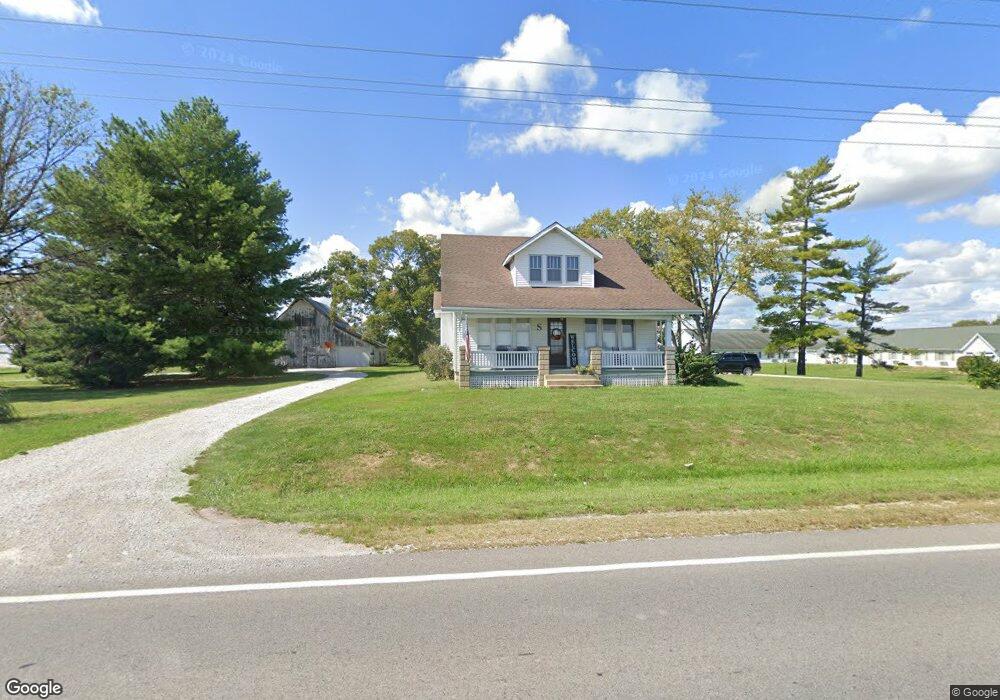
1621 S Main St Red Bud, IL 62278
Estimated Value: $124,000 - $198,000
--
Bed
--
Bath
--
Sq Ft
0.79
Acres
About This Home
This home is located at 1621 S Main St, Red Bud, IL 62278 and is currently estimated at $158,272. 1621 S Main St is a home located in Randolph County with nearby schools including Red Bud Elementary School, Red Bud High School, and St. Johns Lutheran School.
Ownership History
Date
Name
Owned For
Owner Type
Purchase Details
Closed on
Mar 15, 2019
Sold by
Cowell Dean Clyde and Keil Dian Lynn
Bought by
Spence Trevallian A and Mueller Trisha M
Current Estimated Value
Home Financials for this Owner
Home Financials are based on the most recent Mortgage that was taken out on this home.
Original Mortgage
$103,550
Interest Rate
4.75%
Mortgage Type
New Conventional
Purchase Details
Closed on
Dec 28, 2017
Sold by
Moll Michael J and Moll Kimberly A
Bought by
Mkm Commercial Llc
Create a Home Valuation Report for This Property
The Home Valuation Report is an in-depth analysis detailing your home's value as well as a comparison with similar homes in the area
Home Values in the Area
Average Home Value in this Area
Purchase History
| Date | Buyer | Sale Price | Title Company |
|---|---|---|---|
| Spence Trevallian A | $109,000 | None Available | |
| Spence Trevallian A | $109,500 | None Available | |
| Mkm Commercial Llc | -- | None Available |
Source: Public Records
Mortgage History
| Date | Status | Borrower | Loan Amount |
|---|---|---|---|
| Previous Owner | Spence Trevallian A | $103,550 |
Source: Public Records
Tax History Compared to Growth
Tax History
| Year | Tax Paid | Tax Assessment Tax Assessment Total Assessment is a certain percentage of the fair market value that is determined by local assessors to be the total taxable value of land and additions on the property. | Land | Improvement |
|---|---|---|---|---|
| 2024 | $2,136 | $41,740 | $33,150 | $8,590 |
| 2023 | $1,978 | $39,085 | $31,040 | $8,045 |
| 2022 | $1,786 | $36,435 | $28,935 | $7,500 |
| 2021 | $1,726 | $34,880 | $27,700 | $7,180 |
| 2020 | $1,763 | $35,727 | $28,374 | $7,353 |
| 2019 | $2,094 | $32,150 | $6,180 | $25,970 |
| 2018 | $1,426 | $35,445 | $6,813 | $28,632 |
| 2017 | $164 | $30,770 | $5,915 | $24,855 |
| 2016 | $158 | $29,840 | $5,735 | $24,105 |
| 2015 | $157 | $29,400 | $5,650 | $23,750 |
| 2014 | $157 | $30,055 | $5,775 | $24,280 |
| 2013 | $214 | $30,055 | $5,775 | $24,280 |
Source: Public Records
Map
Nearby Homes
- 254 Charles St
- 308 S Main St
- 115 S Taylor St
- 304 Country Club Dr
- 323 N Main St
- 1125 E Market St
- 985 Powell Rd
- 9668 S Prairie Rd
- 3554 Russell Dr
- 201 Kaskaskia St
- 370 W Mill St
- 1916 Ames Rd
- 0 White Swan Park Unit 32 17096895
- 000 Mm Rd
- 0 Mm Rd
- Lot 2 E Back St
- Lot 1 E Back St
- 1007 Liberty St
- 5728 Brand Woods Dr
- 300 Freedom Dr
- 1625 S Main St
- 1617 S Main St
- 1607 S Main St
- 114 Lois Ln
- 1610 S Main St
- 4825 Black Jack Rd
- 1510 S Main St
- 1506 S Main St
- 1420 Locust St
- 10429 State Route 3
- 1231 Janice St
- 1237 Janice St
- 1225 Janice St
- 222 E Shiloh Dr
- 5047 Ohlwine Rd
- 214 E Shiloh Dr
- 1241 Janice St
- 1247 Janice St
- 237 Kaskaskia Dr
- 218 E Shiloh Dr