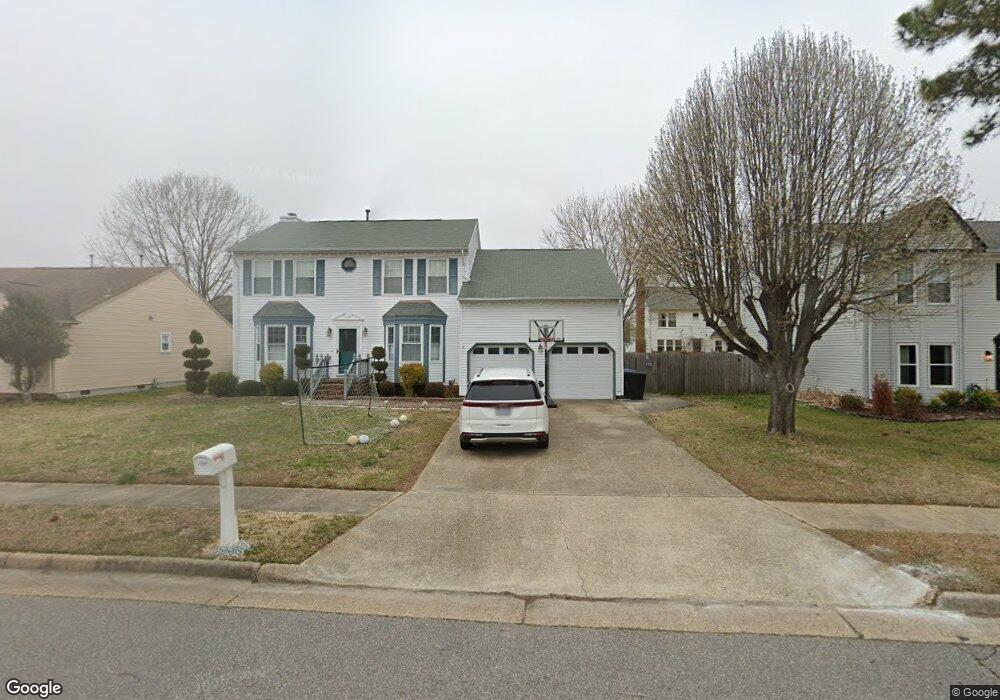
1621 Sinking Creek Dr Virginia Beach, VA 23464
Estimated Value: $480,000 - $555,000
4
Beds
3
Baths
2,400
Sq Ft
$215/Sq Ft
Est. Value
About This Home
This home is located at 1621 Sinking Creek Dr, Virginia Beach, VA 23464 and is currently estimated at $516,468, approximately $215 per square foot. 1621 Sinking Creek Dr is a home located in Virginia Beach City with nearby schools including Indian Lakes Elementary School, Brandon Middle School, and Tallwood High School.
Ownership History
Date
Name
Owned For
Owner Type
Purchase Details
Closed on
Jan 27, 2020
Sold by
Worst Robert J and Worst Jeannette
Bought by
Yi Jung and Yoo Eunhae
Current Estimated Value
Home Financials for this Owner
Home Financials are based on the most recent Mortgage that was taken out on this home.
Original Mortgage
$337,590
Outstanding Balance
$299,019
Interest Rate
3.73%
Mortgage Type
VA
Estimated Equity
$217,449
Purchase Details
Closed on
Oct 27, 2014
Sold by
Gordon Ian T
Bought by
Worst Robert J
Home Financials for this Owner
Home Financials are based on the most recent Mortgage that was taken out on this home.
Original Mortgage
$307,000
Interest Rate
4.21%
Mortgage Type
VA
Purchase Details
Closed on
Jun 30, 2006
Sold by
Gourdeau Michael
Bought by
Woodside Carla
Home Financials for this Owner
Home Financials are based on the most recent Mortgage that was taken out on this home.
Original Mortgage
$283,900
Interest Rate
6.6%
Mortgage Type
New Conventional
Create a Home Valuation Report for This Property
The Home Valuation Report is an in-depth analysis detailing your home's value as well as a comparison with similar homes in the area
Home Values in the Area
Average Home Value in this Area
Purchase History
| Date | Buyer | Sale Price | Title Company |
|---|---|---|---|
| Yi Jung | $330,000 | Attorney | |
| Worst Robert J | $307,000 | -- | |
| Woodside Carla | $354,900 | -- |
Source: Public Records
Mortgage History
| Date | Status | Borrower | Loan Amount |
|---|---|---|---|
| Open | Yi Jung | $337,590 | |
| Previous Owner | Worst Robert J | $307,000 | |
| Previous Owner | Woodside Carla | $283,900 |
Source: Public Records
Tax History Compared to Growth
Tax History
| Year | Tax Paid | Tax Assessment Tax Assessment Total Assessment is a certain percentage of the fair market value that is determined by local assessors to be the total taxable value of land and additions on the property. | Land | Improvement |
|---|---|---|---|---|
| 2025 | $3,995 | $442,600 | $157,500 | $285,100 |
| 2024 | $3,995 | $411,900 | $150,000 | $261,900 |
| 2023 | $3,893 | $393,200 | $140,000 | $253,200 |
| 2022 | $3,457 | $349,200 | $122,000 | $227,200 |
| 2021 | $3,225 | $325,800 | $105,000 | $220,800 |
| 2020 | $3,017 | $296,500 | $98,000 | $198,500 |
| 2019 | $2,834 | $274,500 | $94,000 | $180,500 |
| 2018 | $2,752 | $274,500 | $94,000 | $180,500 |
| 2017 | $2,756 | $274,900 | $90,000 | $184,900 |
| 2016 | $2,702 | $272,900 | $88,000 | $184,900 |
| 2015 | $2,700 | $272,700 | $87,800 | $184,900 |
| 2014 | $2,386 | $271,100 | $104,000 | $167,100 |
Source: Public Records
Map
Nearby Homes
- 5276 Settlers Park Dr
- 1630 Jameson Dr
- 5250 Settlers Park Dr
- 5102 Settlers Park Dr
- 5126 Settlers Park Dr
- 1716 Chilhowie Cir
- 1408 Ships Landing
- 5254 Lake Victoria Arch
- 1617 Sweet Bay Ct
- 5441 Brookfield Dr
- 1593 Mill Oak Dr
- 5029 Hillswick Dr
- 5151 Westerly Dr
- 1488 Coolspring Way
- 4905 Hillswick Dr
- 5369 Bagpipers Ln
- 1340 Burlington Rd
- 4972 Montrose Dr
- 1550 Sangaree Cir
- 5545 MacGuffie St
- 1625 Sinking Creek Dr
- 1632 Wicomico Ln
- 1628 Wicomico Ln
- 1636 Wicomico Ln
- 1613 Sinking Creek Dr
- 1620 Sinking Creek Dr
- 1629 Sinking Creek Dr
- 1612 Sinking Creek Dr
- 1624 Wicomico Ln
- 5200 Sinking Creek Ct
- 1640 Wicomico Ln
- 1609 Sinking Creek Dr
- 1633 Sinking Creek Dr
- 5204 Sinking Creek Ct
- 1620 Wicomico Ln
- 1608 Sinking Creek Dr
- 1633 Wicomico Ln
- 1637 Wicomico Ln
- 1644 Wicomico Ln
- 1629 Wicomico Ln