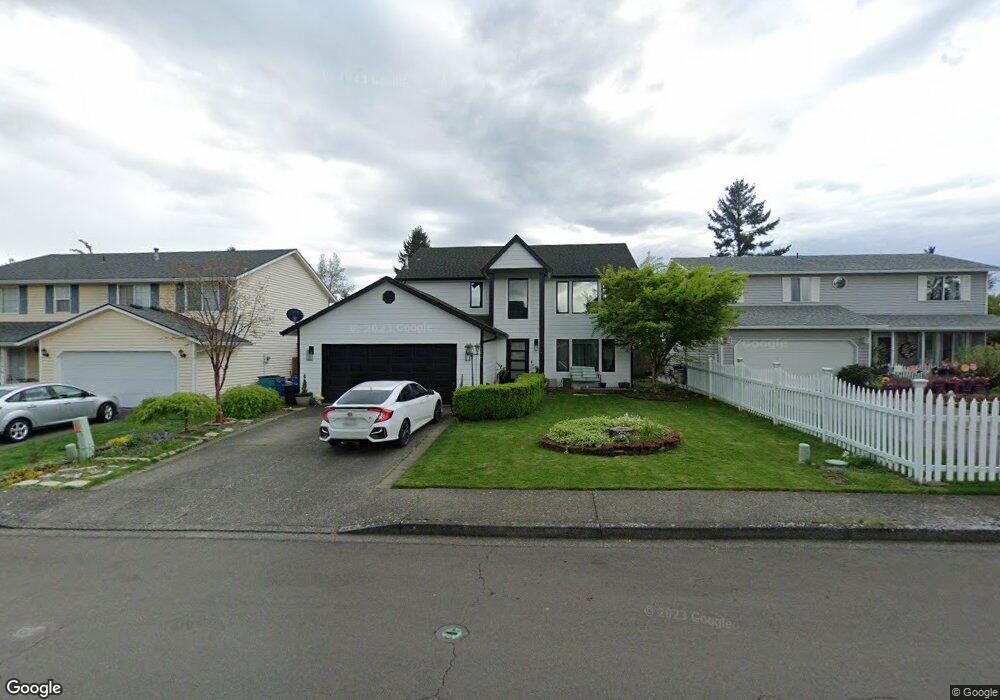
16217 NE 12th St Vancouver, WA 98684
Mill Plain NeighborhoodEstimated Value: $474,000 - $559,000
3
Beds
3
Baths
1,984
Sq Ft
$260/Sq Ft
Est. Value
About This Home
This home is located at 16217 NE 12th St, Vancouver, WA 98684 and is currently estimated at $515,388, approximately $259 per square foot. 16217 NE 12th St is a home located in Clark County with nearby schools including Harmony Elementary School, Pacific Middle School, and Union High School.
Ownership History
Date
Name
Owned For
Owner Type
Purchase Details
Closed on
May 29, 2018
Sold by
Green Baroven C
Bought by
Santos Ryan P and Santos Kathryn A
Current Estimated Value
Home Financials for this Owner
Home Financials are based on the most recent Mortgage that was taken out on this home.
Original Mortgage
$264,000
Outstanding Balance
$227,799
Interest Rate
4.4%
Mortgage Type
New Conventional
Estimated Equity
$287,589
Purchase Details
Closed on
Aug 1, 1997
Sold by
Serles James A and Serles Anne M
Bought by
Meli Stephen C
Home Financials for this Owner
Home Financials are based on the most recent Mortgage that was taken out on this home.
Original Mortgage
$140,450
Interest Rate
10.62%
Purchase Details
Closed on
May 24, 1995
Sold by
Woo Nelson C and Woo Julia K
Bought by
Serles James A and Serles Anne M
Home Financials for this Owner
Home Financials are based on the most recent Mortgage that was taken out on this home.
Original Mortgage
$104,000
Interest Rate
7%
Create a Home Valuation Report for This Property
The Home Valuation Report is an in-depth analysis detailing your home's value as well as a comparison with similar homes in the area
Home Values in the Area
Average Home Value in this Area
Purchase History
| Date | Buyer | Sale Price | Title Company |
|---|---|---|---|
| Santos Ryan P | $264,000 | Chicago Title | |
| Meli Stephen C | $156,100 | Chicago Title Insurance Co | |
| Serles James A | $140,000 | Chicago Title Insurance Co |
Source: Public Records
Mortgage History
| Date | Status | Borrower | Loan Amount |
|---|---|---|---|
| Open | Santos Ryan P | $264,000 | |
| Previous Owner | Meli Stephen C | $140,450 | |
| Previous Owner | Serles James A | $104,000 |
Source: Public Records
Tax History Compared to Growth
Tax History
| Year | Tax Paid | Tax Assessment Tax Assessment Total Assessment is a certain percentage of the fair market value that is determined by local assessors to be the total taxable value of land and additions on the property. | Land | Improvement |
|---|---|---|---|---|
| 2025 | $4,611 | $458,626 | $179,000 | $279,626 |
| 2024 | $4,486 | $454,470 | $179,000 | $275,470 |
| 2023 | $4,431 | $464,195 | $179,000 | $285,195 |
| 2022 | $3,971 | $451,464 | $172,250 | $279,214 |
| 2021 | $3,695 | $376,597 | $143,900 | $232,697 |
| 2020 | $3,816 | $329,515 | $125,000 | $204,515 |
| 2019 | $3,369 | $342,145 | $135,100 | $207,045 |
| 2018 | $3,619 | $325,903 | $0 | $0 |
| 2017 | $3,352 | $281,921 | $0 | $0 |
| 2016 | $3,181 | $271,613 | $0 | $0 |
| 2015 | $3,082 | $239,939 | $0 | $0 |
| 2014 | -- | $221,280 | $0 | $0 |
| 2013 | -- | $190,212 | $0 | $0 |
Source: Public Records
Map
Nearby Homes
- 1016 NE 163rd Ave
- 16209 NE 11th St
- 16115 NE 8th St
- 16506 NE 13th St
- 16500 SE 1st St
- 16500 SE 1st St Unit 14
- 16500 SE 1st St Unit 170
- 16500 SE 1st St Unit 44
- 16500 SE 1st St Unit 98
- 16500 SE 1st St Unit 144
- 16500 SE 1st St Unit 68
- 16500 SE 1st St Unit 46
- 16715 NE 5th St
- 1111 NE 171st Ct
- 419 NE 169th Ave
- 17006 NE 6th St
- 1900 NE 158th Ave
- 16812 SE 1st St Unit 74
- 16812 SE 1st St Unit 71
- 16812 SE 1st St Unit 80
- 16219 NE 12th St
- 16215 NE 12th St
- 16221 NE 12th St
- 16209 NE 12th St
- 16216 NE 11th St
- 16220 NE 11th St
- 16301 NE 12th St
- 16216 NE 12th St
- 1202 NE 162nd Place
- 16218 NE 12th St
- 1204 NE 162nd Place
- 16208 NE 11th St
- 1204 NE 163rd Ct
- 16308 NE 11th St
- 16303 NE 12th St
- 1208 NE 162nd Place
- 1213 NE 162nd Place
- 1212 NE 162nd Place
- 16305 NE 12th St
- 1208 NE 163rd Ct