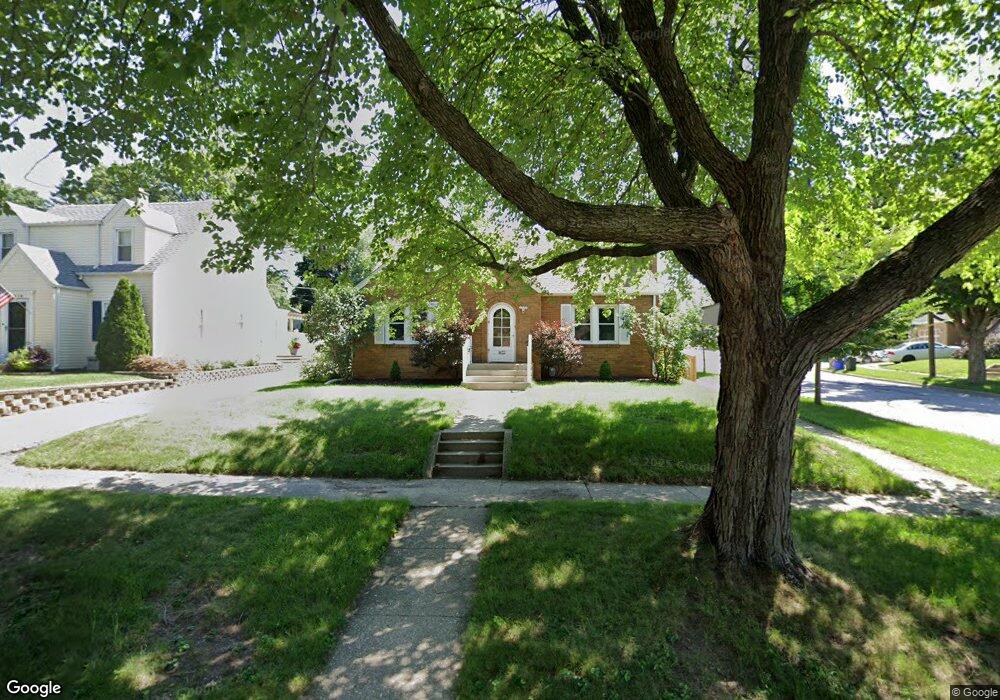
1622 24th St Rockford, IL 61108
Rolling Green NeighborhoodEstimated Value: $189,000 - $241,000
4
Beds
3
Baths
2,729
Sq Ft
$78/Sq Ft
Est. Value
About This Home
This home is located at 1622 24th St, Rockford, IL 61108 and is currently estimated at $212,197, approximately $77 per square foot. 1622 24th St is a home located in Winnebago County with nearby schools including Whitehead Elementary School, Bernard W. Flinn Middle School, and Rockford East High School.
Ownership History
Date
Name
Owned For
Owner Type
Purchase Details
Closed on
Mar 1, 2024
Sold by
Borck Scott D and Borck Julie J
Bought by
Pazmino Manuel Emilio Moroc and Ortiz Ana Marisol
Current Estimated Value
Home Financials for this Owner
Home Financials are based on the most recent Mortgage that was taken out on this home.
Original Mortgage
$7,500
Outstanding Balance
$3,156
Interest Rate
6.9%
Mortgage Type
New Conventional
Estimated Equity
$209,041
Purchase Details
Closed on
Mar 14, 2005
Bought by
Borck Scott D and Borck Julie J
Create a Home Valuation Report for This Property
The Home Valuation Report is an in-depth analysis detailing your home's value as well as a comparison with similar homes in the area
Home Values in the Area
Average Home Value in this Area
Purchase History
| Date | Buyer | Sale Price | Title Company |
|---|---|---|---|
| Pazmino Manuel Emilio Moroc | $200,000 | None Listed On Document | |
| Borck Scott D | $95,000 | -- |
Source: Public Records
Mortgage History
| Date | Status | Borrower | Loan Amount |
|---|---|---|---|
| Open | Pazmino Manuel Emilio Moroc | $7,500 | |
| Open | Pazmino Manuel Emilio Moroc | $178,000 |
Source: Public Records
Tax History Compared to Growth
Tax History
| Year | Tax Paid | Tax Assessment Tax Assessment Total Assessment is a certain percentage of the fair market value that is determined by local assessors to be the total taxable value of land and additions on the property. | Land | Improvement |
|---|---|---|---|---|
| 2024 | $3,309 | $44,793 | $5,672 | $39,121 |
| 2023 | $3,123 | $39,496 | $5,001 | $34,495 |
| 2022 | $2,999 | $32,246 | $4,470 | $27,776 |
| 2021 | $2,889 | $29,568 | $4,099 | $25,469 |
| 2020 | $2,823 | $27,952 | $3,875 | $24,077 |
| 2019 | $2,765 | $26,641 | $3,693 | $22,948 |
| 2018 | $2,708 | $25,107 | $3,480 | $21,627 |
| 2017 | $2,675 | $24,028 | $3,330 | $20,698 |
| 2016 | $2,655 | $23,578 | $3,268 | $20,310 |
| 2015 | $2,689 | $23,578 | $3,268 | $20,310 |
| 2014 | $3,501 | $25,185 | $4,076 | $21,109 |
Source: Public Records
Map
Nearby Homes