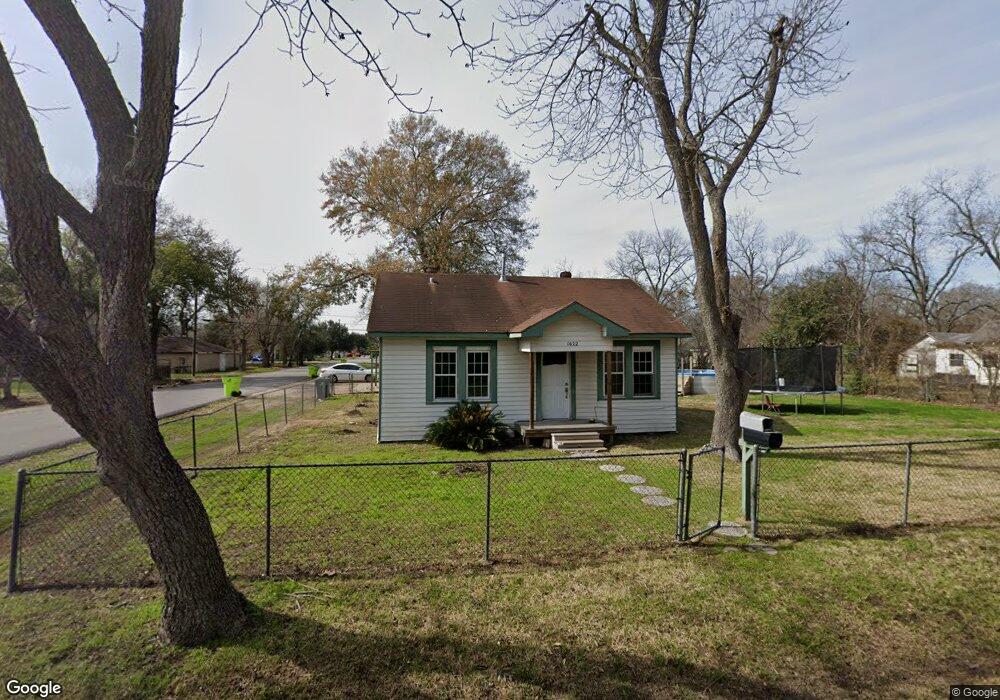
1622 7th St Rosenberg, TX 77471
Estimated Value: $202,099 - $270,000
2
Beds
1
Bath
1,524
Sq Ft
$154/Sq Ft
Est. Value
About This Home
This home is located at 1622 7th St, Rosenberg, TX 77471 and is currently estimated at $234,025, approximately $153 per square foot. 1622 7th St is a home located in Fort Bend County with nearby schools including Taylor Ray Elementary School, George Junior High School, and B.F. Terry High School.
Ownership History
Date
Name
Owned For
Owner Type
Purchase Details
Closed on
Apr 18, 2013
Sold by
Rivera Rutilo
Bought by
Rivera Maria I
Current Estimated Value
Purchase Details
Closed on
Jun 11, 1999
Sold by
Martinez Victor and Martinez Adonia
Bought by
Rivera Maria I and Rivera Rutilo
Home Financials for this Owner
Home Financials are based on the most recent Mortgage that was taken out on this home.
Original Mortgage
$42,750
Outstanding Balance
$11,247
Interest Rate
7.02%
Estimated Equity
$222,778
Purchase Details
Closed on
Dec 19, 1997
Sold by
Pizarro Juan C and Pizarro Gloria A
Bought by
Martinez Victor and Martinez Adonia
Purchase Details
Closed on
Feb 8, 1994
Sold by
Kocurek W A
Bought by
Ramirez Maria I
Create a Home Valuation Report for This Property
The Home Valuation Report is an in-depth analysis detailing your home's value as well as a comparison with similar homes in the area
Home Values in the Area
Average Home Value in this Area
Purchase History
| Date | Buyer | Sale Price | Title Company |
|---|---|---|---|
| Rivera Maria I | -- | None Available | |
| Rivera Maria I | -- | Fort Bend Title Company | |
| Martinez Victor | -- | -- | |
| Ramirez Maria I | -- | -- |
Source: Public Records
Mortgage History
| Date | Status | Borrower | Loan Amount |
|---|---|---|---|
| Open | Rivera Maria I | $42,750 |
Source: Public Records
Tax History
| Year | Tax Paid | Tax Assessment Tax Assessment Total Assessment is a certain percentage of the fair market value that is determined by local assessors to be the total taxable value of land and additions on the property. | Land | Improvement |
|---|---|---|---|---|
| 2025 | $1,527 | $168,984 | $110,488 | $93,752 |
| 2024 | $1,527 | $153,622 | $26,897 | $126,725 |
| 2023 | $1,329 | $139,656 | $12,740 | $126,916 |
| 2022 | $1,899 | $126,960 | $26,430 | $100,530 |
| 2021 | $2,395 | $115,420 | $77,610 | $37,810 |
| 2020 | $2,227 | $104,930 | $76,670 | $28,260 |
| 2019 | $2,179 | $95,390 | $44,860 | $50,530 |
| 2018 | $2,013 | $86,720 | $44,860 | $41,860 |
| 2017 | $1,840 | $78,840 | $44,860 | $33,980 |
| 2016 | $1,673 | $71,670 | $44,860 | $26,810 |
| 2015 | $1,254 | $72,250 | $44,860 | $27,390 |
| 2014 | $1,379 | $70,850 | $44,860 | $25,990 |
Source: Public Records
Map
Nearby Homes
Your Personal Tour Guide
Ask me questions while you tour the home.